Bitcoin’s price once again failed to reach a new all-time high last week.
However, the bull market might be far from over.
Technical Analysis
By Edris Derakhshi (TradingRage)
The Daily Chart
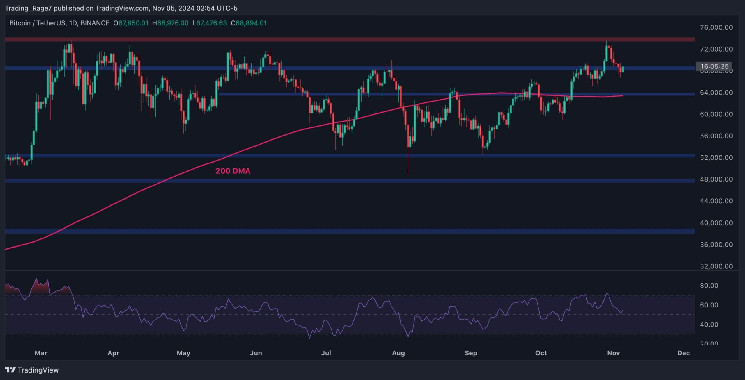
On the daily chart, the asset has been rejected from the $74K resistance level, and the $69K support zone is currently being tested. If this area holds, the market could reach a record high soon.
However, in case of a breakdown, the 200-day moving average, located around the $64K level, would be the next area of interest. Meanwhile, judging by the overall market structure, the trend can still be considered bullish, and it could only be a matter of time for BTC to start a new rally.
The 4-Hour Chart
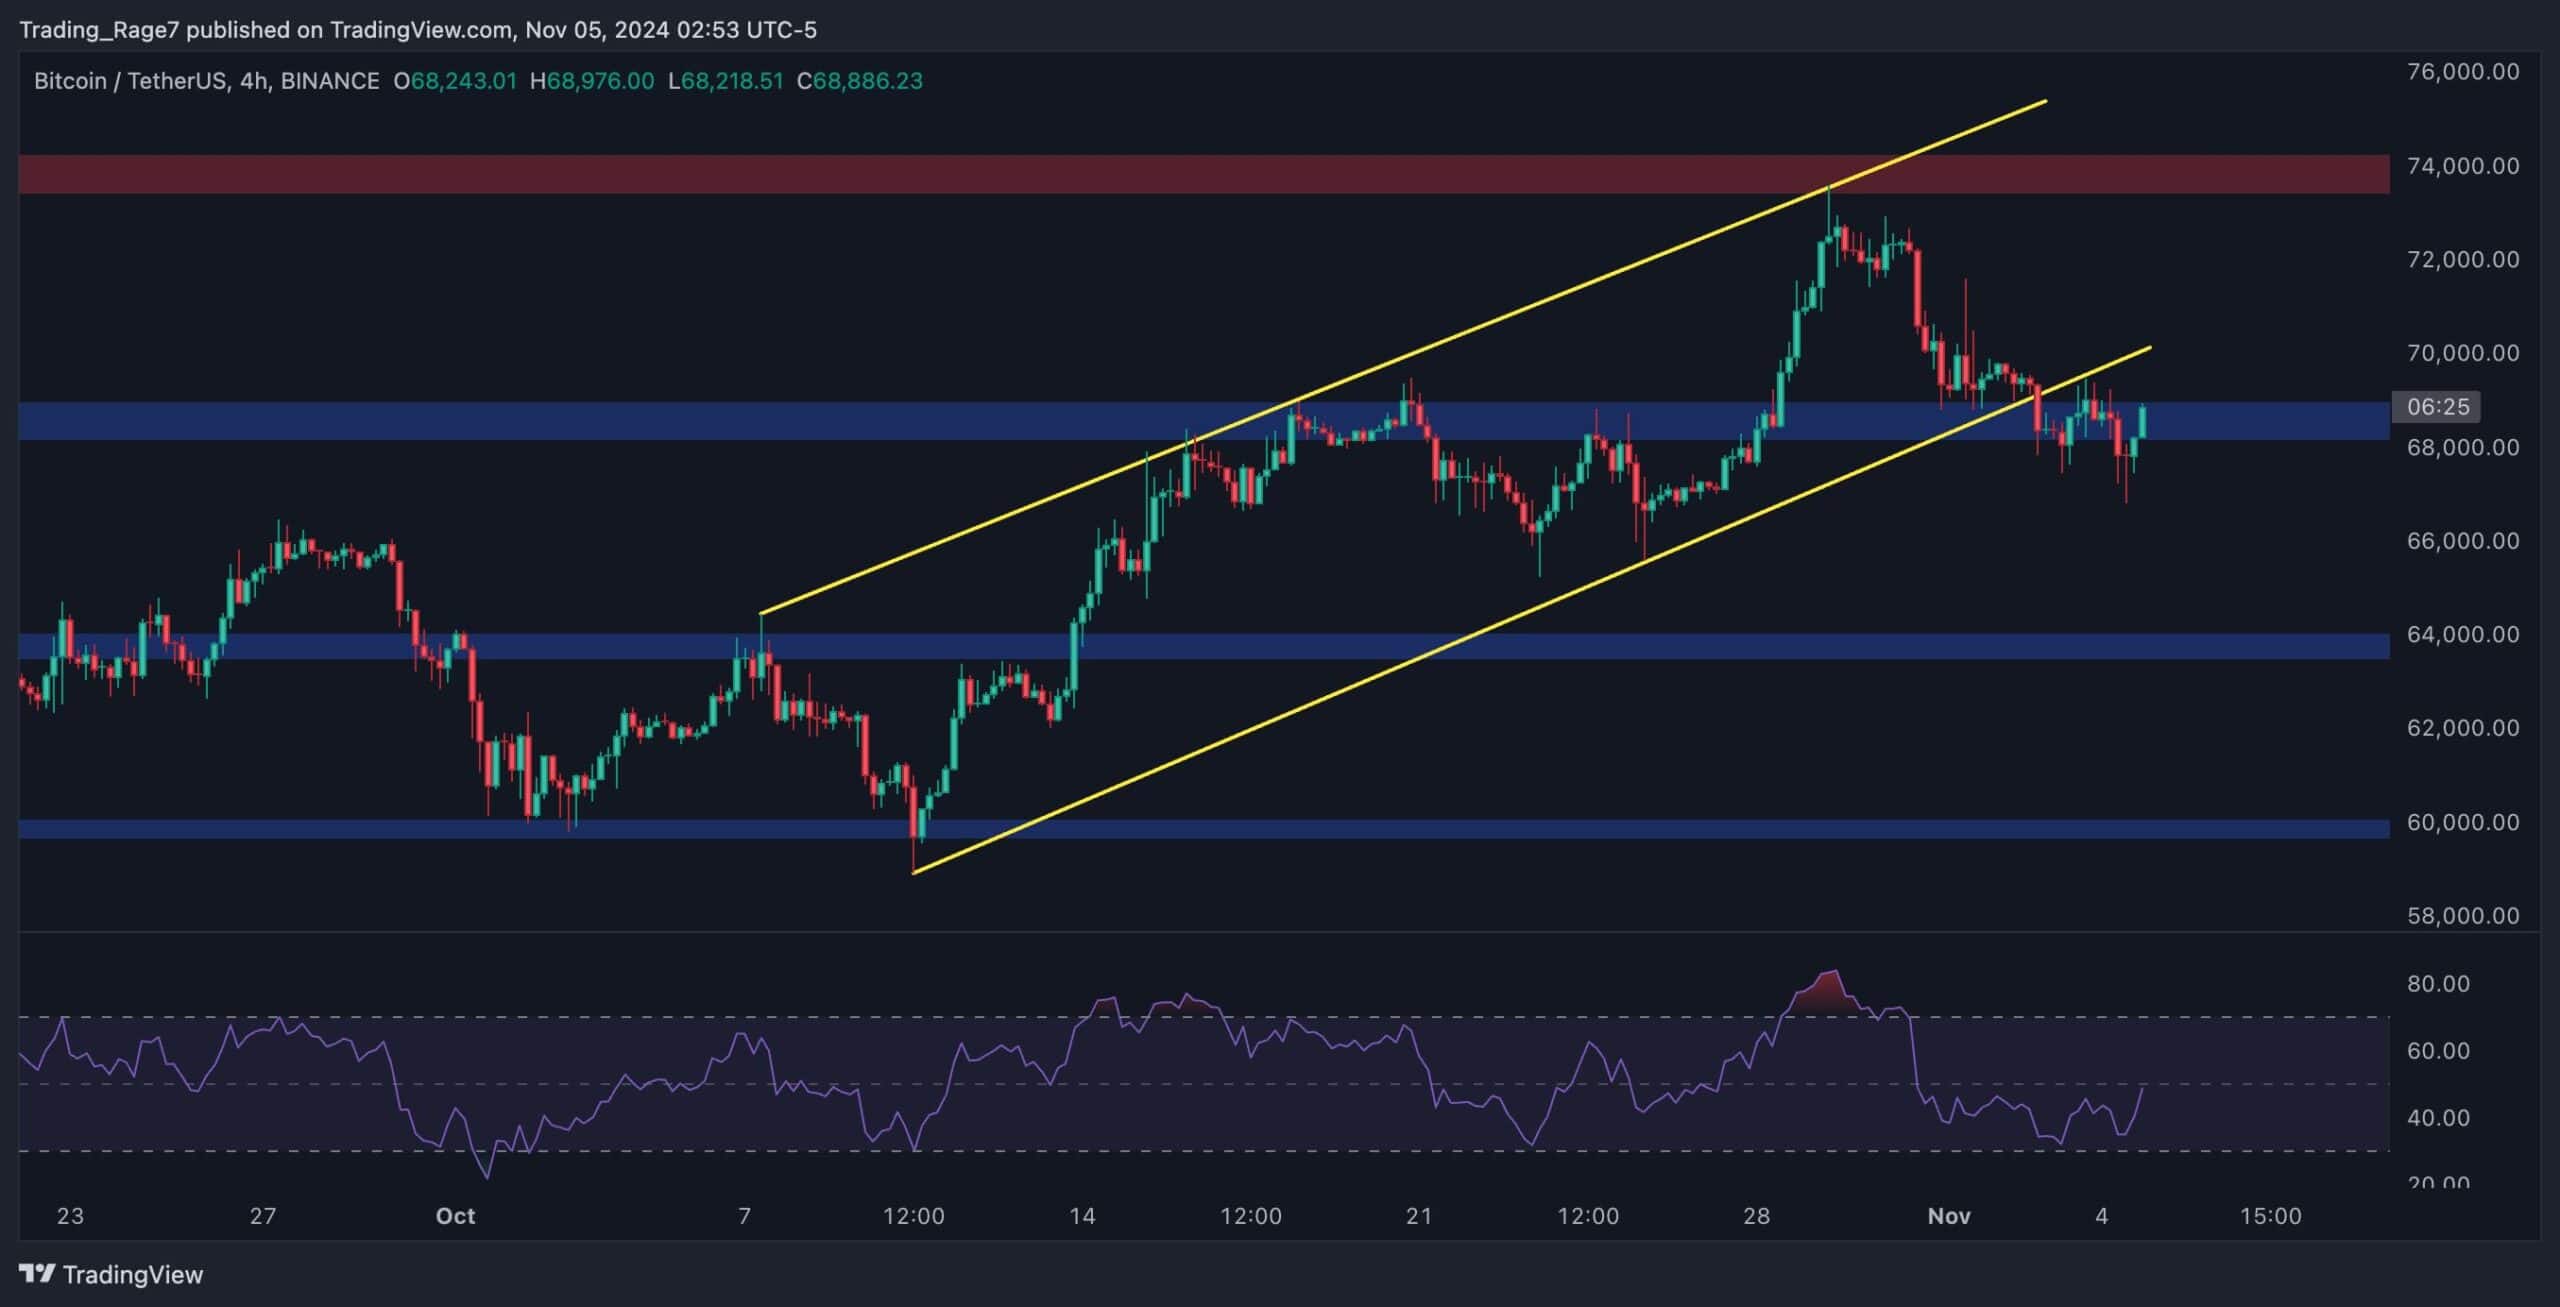
Looking at the 4-hour chart, the price broke below the ascending channel a few days ago and has failed to recover since. Yet, a double-bottom pattern with a bullish RSI divergence is currently forming at the $69K support zone.
A bullish continuation could be expected if the asset successfully climbs back above the $70K mark and inside the channel. Yet, a further correction toward the $64K support level is still possible, especially if the $69K area is broken to the downside.
On-Chain Analysis
By Edris Derakhshi (TradingRage)
Bitcoin Active Addresses
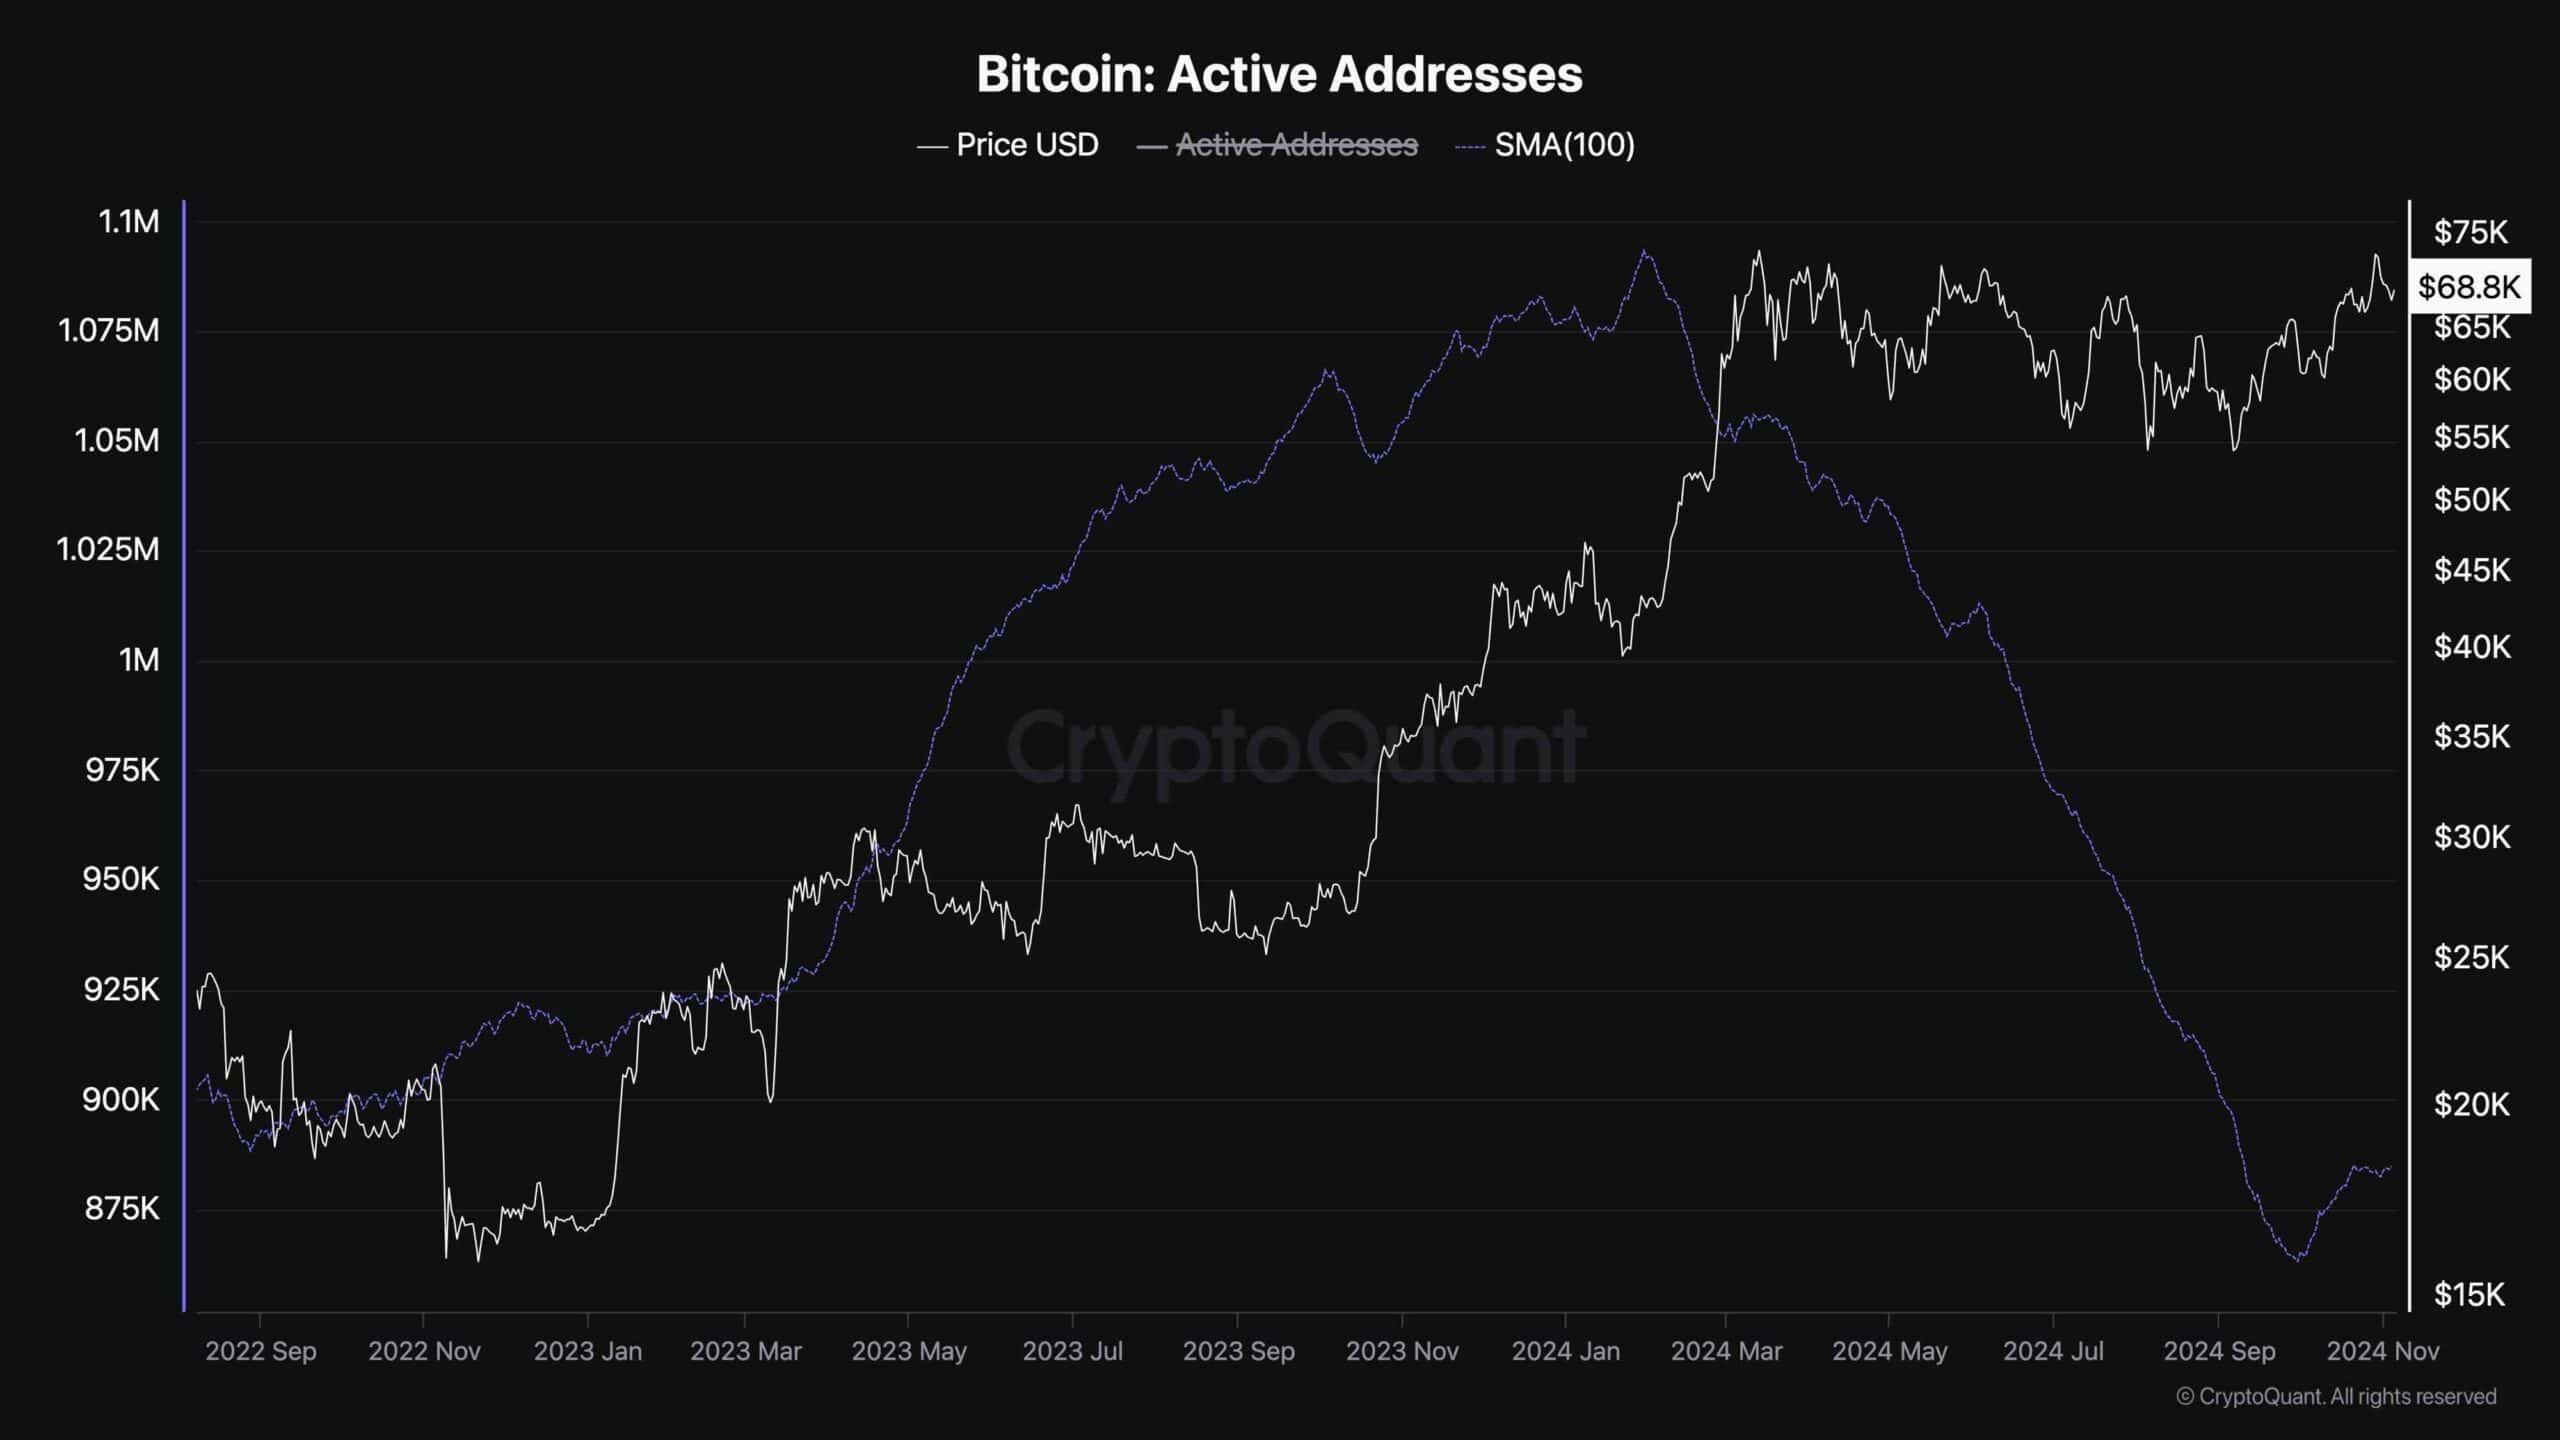
While Bitcoin’s price has been recovering from its frustrating correction over the last few months, many industry participants are hopeful that the bull market is about to begin. Yet, a key metric is still lagging behind.
This chart presents the 100-day moving average of the BTC active addresses. As evident, the amount of network activity is at its lowest over the past couple of years, which is not a good sign. However, the number of active addresses has been increasing gradually, which is a typical signal at the beginning of bullish trend. Therefore, if this growth in network activity continues, higher Bitcoin prices can be expected soon.
Read the full article here


