As Bitcoin forms an evening star pattern, is a pullback to $84,000 imminent, or will the bull run continue toward $100,000?
As bullish exhaustion leads to a minor pullback in Bitcoin, the streak of new all-time highs takes a pause. Currently, the BTC price is trading below the $88,000 mark with a market cap of $1.75 trillion.
Over the past 30 days, Bitcoin has increased by more than 40%. Will the latest minor pullback delay the Bitcoin price target of $100,000? Let’s find out.
Bitcoin Price Analysis
Bitcoin is currently trading at $87,496, with an intraday pullback of 0.61% from the opening price of $88,038. Yesterday, the price formed a doji candle, with a downfall of 0.83%.
This warned of an evening star pattern, as it had formed a massive bullish engulfing candle with a 10.38% surge on Monday.
Further, Bitcoin’s bearish reversal occurred from the 1.618 Fibonacci level, which was priced at $88,574. In the recent cycle, the BTC price formed its all-time high at $90,243 on the Bitstamp exchange.
As the evening star pattern warns of a pullback, the lower price rejection in the intraday candle teases a bullish extension. Furthermore, the growing bullish influence teases a positive crossover between the 100-day and 200-day simple moving average lines.
This means the average lines are ready for a positive alignment following the golden crossover. Hence, the dynamic lines trigger a buy signal for Bitcoin. Meanwhile, the MACD and signal lines continue to prosper, with a surge of positive histograms signaling healthy bullish momentum.
MVRV Shows Room for Growth Amid Growing Network
Amid the increasing demand for crypto, the active Bitcoin addresses have surpassed the 1 million mark. Furthermore, the number of transactions and transaction fees over the Bitcoin network has significantly increased, per Intotheblock.
Bitcoin Network Growth
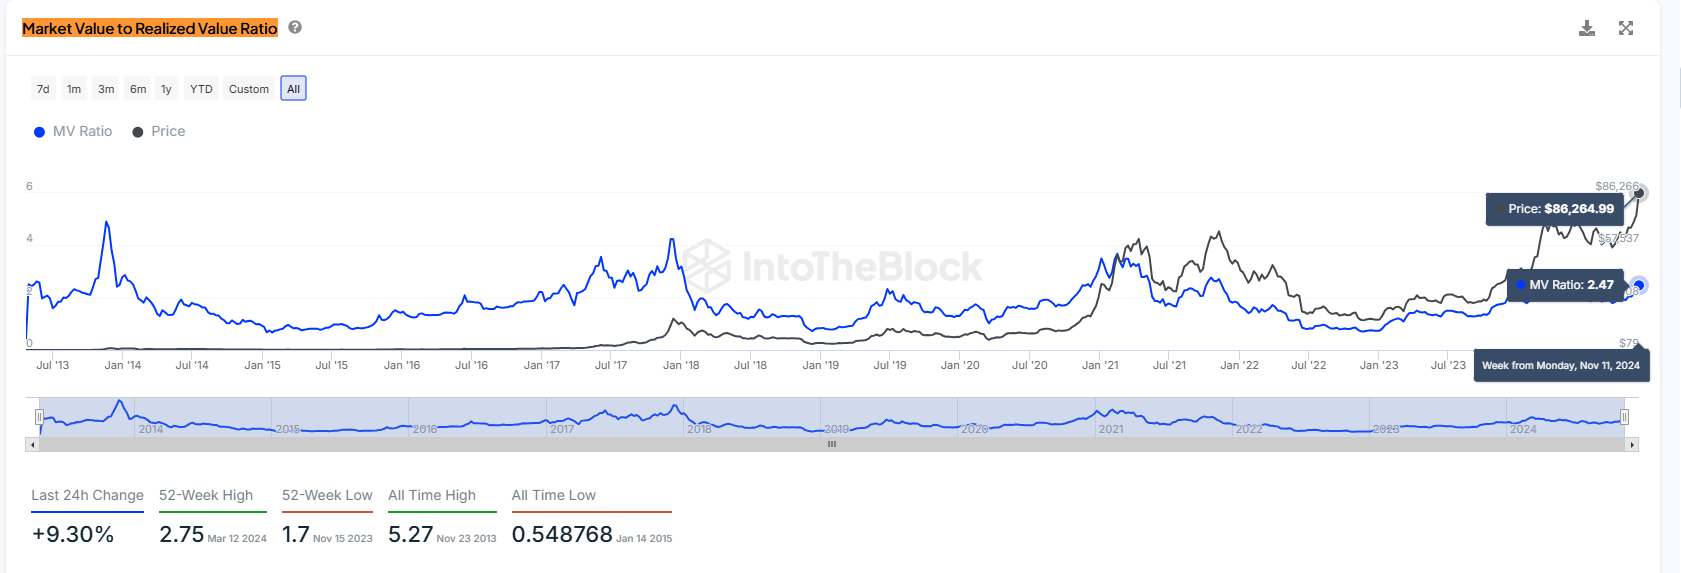
Over the past week, large transactions have surged to 33.33K, with a total transaction volume of 1.36 million BTC. This marks a seven-day high in both transaction count and volume. With the network growing stronger, the market value to realized value (MVRV) ratio indicates that there is still room for further growth.
Historically, the MVRV ratio has been useful in identifying market tops. In 2013, it peaked at 4.91; in 2017, it hit 4.24; and in 2021, it reached 3.68. These peaks in the MVRV ratio often signal market tops.

Bitcoin MVRVCurrently, the MVRV ratio stands at 2.47 as the BTC price continues to create new all-time high levels. Based on the tweet from IntoTheBlock, historical values between 2.6 and 5 have aligned with market tops.
Furthermore, with the previous peak at 3.68 MVRV, the lower peak is expected to form near 3. Hence, the present MVRV ratio at 2.47 shows significant room for growth in Bitcoin.
Bitcoin Price Targets
Based on the Fibonacci retracement tool, Bitcoin’s upside targets are $97,781 and $104,337 at the 2 and 2.272 Fibonacci levels. However, for Bitcoin to reach these levels, it will need to break through the 1.618 Fibonacci resistance level at $88,574.
Conversely, the crucial support levels for Bitcoin are at $84,000 and $80,000.
Read the full article here


