In the last hour, bitcoin’s price is coasting along between $97,865 to $98,580 on Nov. 29, 2024, after a bullish rally that pushed the market cap to $1.95 trillion. The cryptocurrency’s technical indicators suggest a strong upward momentum across multiple timeframes, though significant resistance looms near the $100,000 mark.
Bitcoin
Bitcoin’s (BTC) 1-hour chart reveals a strong uptrend, characterized by higher highs and higher lows. Recent consolidation around $94,000 to $96,000 broke upward, fueling the price rally toward $98,000. Buying pressure, evidenced by a volume spike on the last green candle, suggests continued bullish interest.
Short-term resistance lies at $99,000, a psychological threshold before the pivotal $100,000 level. Traders seeking entries could aim for pullbacks to the $96,500–$97,000 zone, with an exit strategy targeting $99,000–$100,000.
BTC/USD – 1H
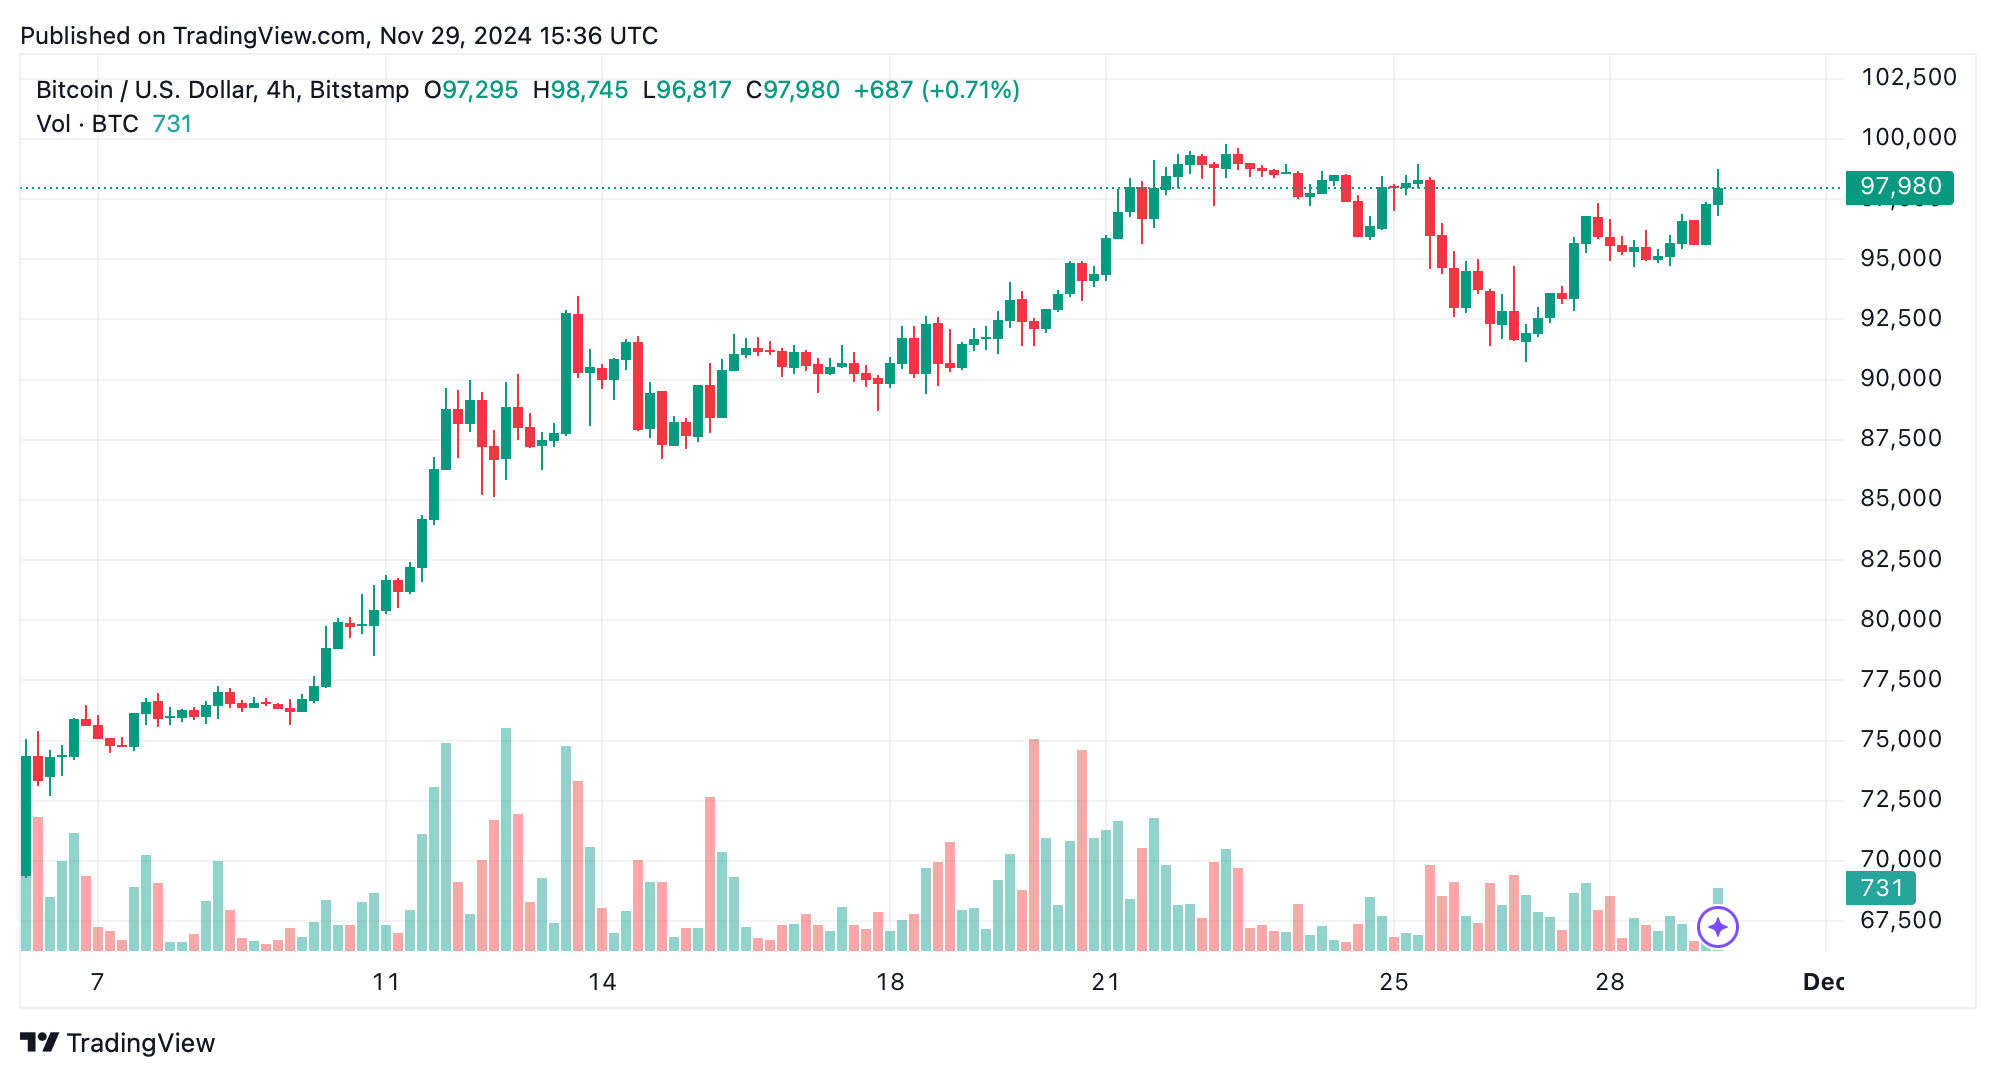
BTC’s 4-hour chart paints a picture of resilience following a corrective phase. A double-bottom structure near $90,742 triggered a robust bullish reversal, with prices now retesting prior highs. Buy volume has steadily increased, indicating accumulation by market participants.
Key levels to watch include resistance at $98,966 and support at $95,000. Aggressive traders might capitalize on pullbacks to $96,000–$96,500, while more conservative entries could await a breakout above $98,966. Exits are advisable near $99,000 or higher.

BTC/USD – 4H
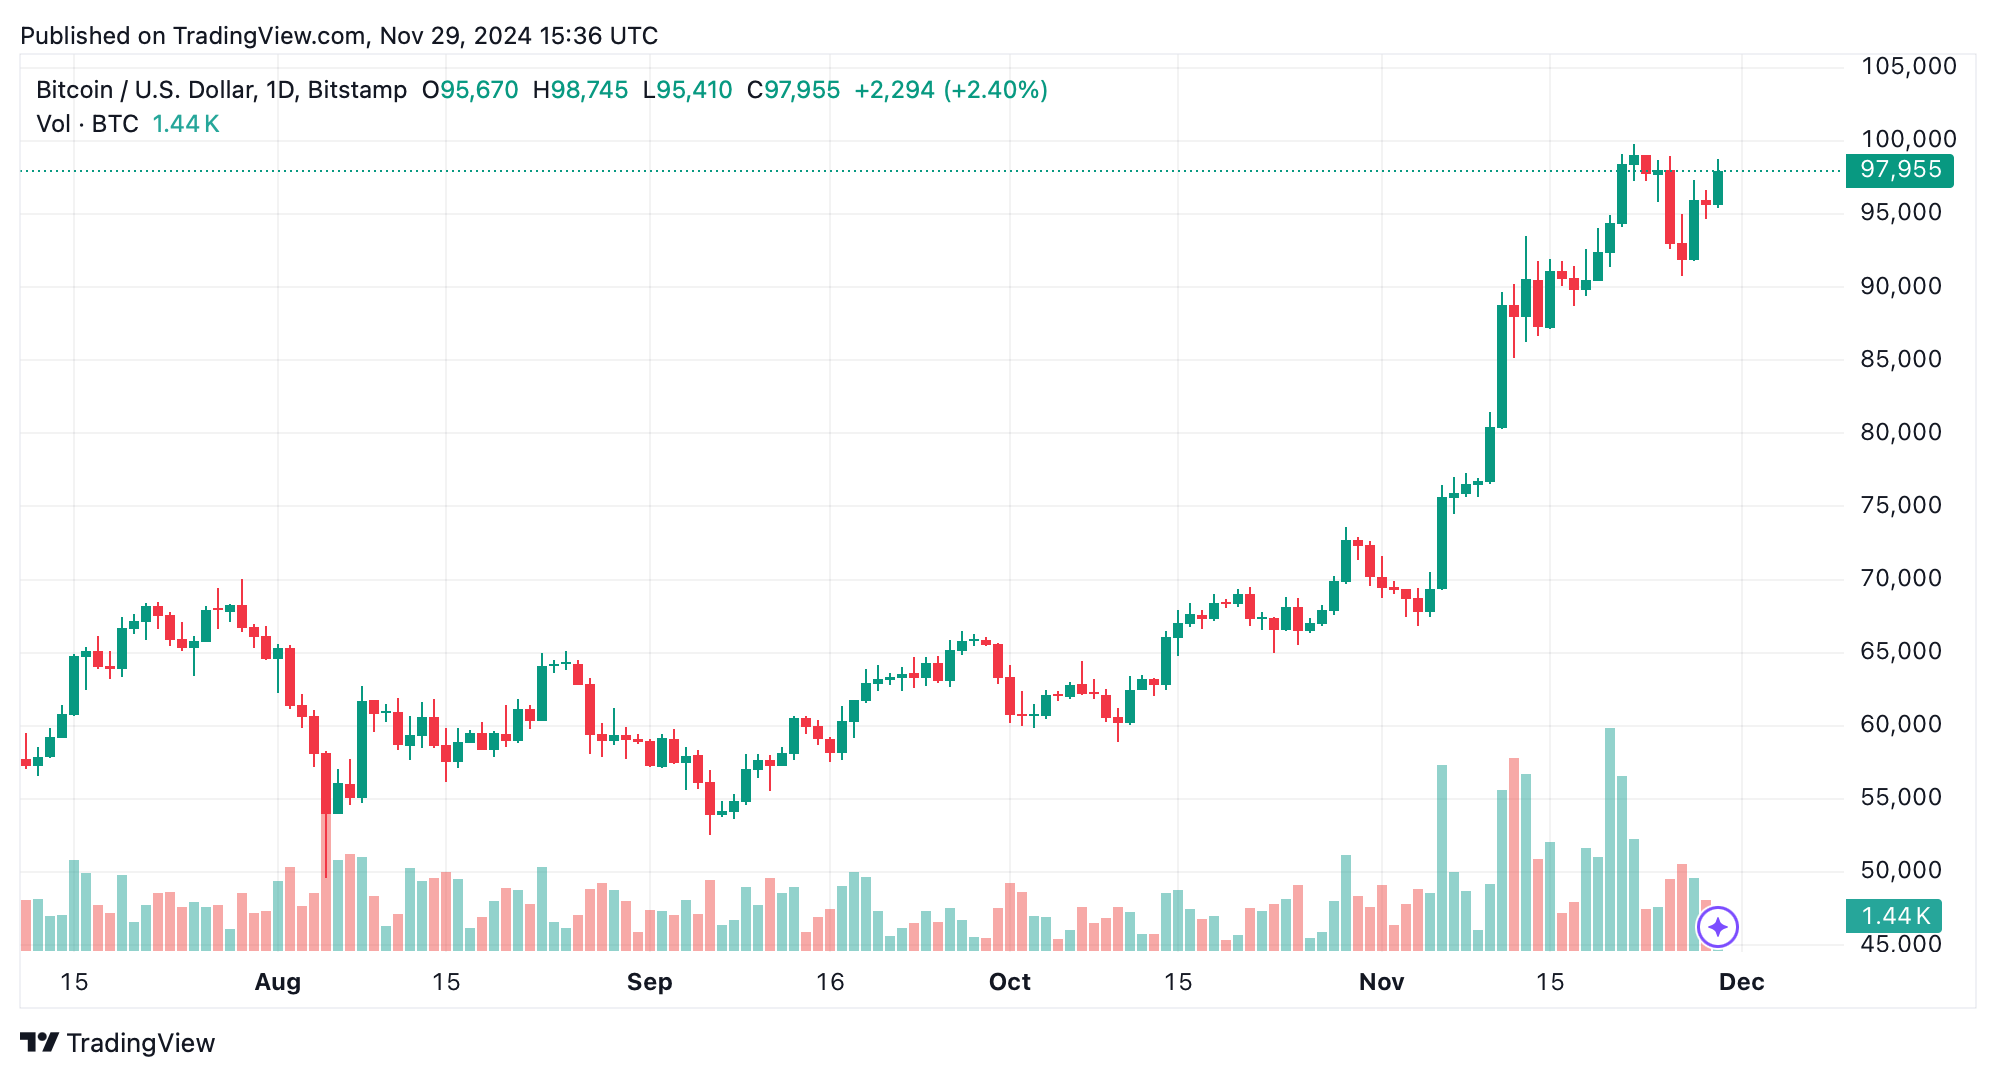
Bitcoin’s daily chart highlights a sustained uptrend from $66,798 to a recent high of $98,800. While the rally’s pace has slowed, evidenced by tapering volume, the upward trajectory remains intact. Resistance between $99,800 and $100,000 acts as a psychological barrier, while support clusters at $92,000–$94,000.
Long-term traders may consider buying dips toward support zones, with a view to holding through a breakout above $100,000. Risk management should focus on potential corrections near the resistance.

BTC/USD – 1D
The relative strength index (RSI) at 70 remains neutral, as do the Stochastic (76) and commodity channel index (94). Momentum is bullish, as shown by the momentum (10) indicator at 6,252, which signals bullishness. Conversely, the moving average convergence divergence (MACD) level of 5,507 suggests a bearish signal.
All moving averages (MAs) signal bullish momentum. The exponential moving averages (EMA) and simple moving averages (SMA) across 10, 20, 30, 50, 100, and 200 periods uniformly indicate buy, reinforcing the broader trend.
Resistance at $100,000 could prompt profit-taking, stalling further gains. Additionally, declining volume or divergences in momentum could signal weakening bullish momentum. Traders should remain vigilant for macroeconomic developments or crypto-specific news that might shift market dynamics.
Strategies vary by timeframe: short-term traders can focus on breakouts or pullbacks around $96,500–$99,000, while long-term holders should target dips toward $92,000–$94,000. Stop-loss placements below $94,000 are recommended to manage risk effectively.
Bull Verdict:
Bitcoin’s strong upward momentum, combined with robust buy signals from most moving averages and bullish price action across all timeframes, supports a bullish outlook. The rally’s approach to the psychological $100,000 resistance suggests the potential for a breakout, especially if buying interest sustains and volume increases. Traders and investors should prepare for continued upward movement while managing risk near key levels.
Bear Verdict:
Despite bitcoin’s bullish trajectory, caution is warranted as it approaches the critical $100,000 resistance. Indicators such as the moving average convergence divergence (MACD) flashing a sell signal and declining volume on the daily chart highlight the possibility of a slowdown or correction. A break below $94,000 could reverse the current trend, signaling a potential bearish pivot.
Read the full article here


