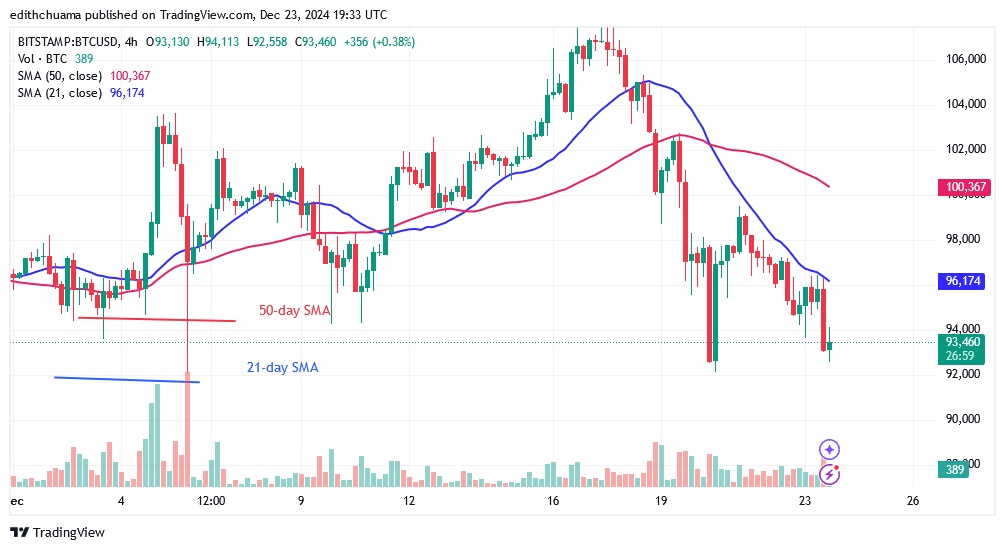
Bitcoin (BTC) price has been stagnant since peaking at $108,000. Cryptocurrency price analysis brought by Coinidol.com.
Bitcoin price long term forecast: bearish
On December 20, the negative trend fell below the moving average lines and was halted by the 50-day SMA. The bulls bought the dips, but their upside momentum was halted by the 21-day SMA, which was between the moving average lines. The negative momentum came to a halt at the 50-day SMA or support at $92,000. Bitcoin is currently confined to the moving average lines. Should the bears break the 50-day SMA support, Bitcoin would drop to a low of $88,000. On the other hand, if the 50-day SMA support holds, Bitcoin will trade above and below the 21-day SMA resistance. In other words, Bitcoin will trade above the $92,000 support but below the $100,000 resistance. At the time of writing, the value of Bitcoin is $93,319.
Bitcoin indicator display
Bitcoin is trapped between two moving average lines. The largest cryptocurrency will perform when either the 50-day SMA support or the 21-day SMA resistance is broken. For example, if the bears break the 50-day SMA support, the selling pressure will increase again. Bitcoin will resume its positive trend if the buyers keep the price above the 21-day SMA resistance.
Technical indicators:
Key resistance levels – $90,000 and $110,000
Key support levels – $70,000 and $50,000
Which cryptocurrency leg for BTC/USD?
The 4-hour chart shows that Bitcoin is trading in a narrow range above the $92,000 support but below the 21-day SMA. The bears have tested the $92,000 level twice as Bitcoin continues its downtrend. The current support level of $92,000 has not been breached since November 26. The uptrend will continue if the existing support holds.

Disclaimer. This analysis and forecast are the personal opinions of the author. They are not a recommendation to buy or sell cryptocurrency and should not be viewed as an endorsement by CoinIdol.com. Readers should do their research before investing in funds.
Read the full article here


