


The Ethereum price is showing signs of a breakout, as an analyst has identified the formation of an inverse head and shoulder pattern on its 6-month long-term price chart. This bullish formation has fueled predictions that Ethereum could rally to $12,000 soon, marking a new all-time high for the second-largest cryptocurrency by market capitalization.
Ethereum Price Targets $12 With New Chart Pattern
In a Tuesday X (formerly Twitter) post, crypto analyst Tony Severino released an Ethereum price chart illustrating an inverse head and shoulder, a technical analysis indicator signaling a potential trend reversal. This distinctive chart pattern has four key components: a left shoulder, head, right shoulder, and neckline.
Typically, when the pattern is completely formed, and a cryptocurrency breaks through the neckline, it indicates a potential shift from a downtrend to an uptrend. In Ethereum’s case, its price has been on a significant downward trajectory, declining by over 8% in the past week.
Despite dropping from a price high of over $4,000 to below $3,500 recently, Severino remains optimistic about Ethereum’s potential for a trend reversal, predicting a bullish price target of $12,000 for the top altcoin.
Examining the analyst’s price chart, the left shoulder of the inverse head and shoulder was formed in 2021, while the head emerged during Ethereum’s price crash at the end of 2022, marking the lowest point in the pattern.
Additionally, the right shoulder of the inverse head and shoulder pattern is complete, with Ethereum recently testing the neckline — a key resistance level by a horizontal trendline. At the time, Ethereum broke above $3,400, confirming the bullish trend reversal often associated with this chart pattern.
Looking at the price chart, the distance between the head and the neckline measures approximately 265.84%, suggesting that Ethereum could rally between $10,000 and $12,000 if the pattern plays out as expected. The upward-sloping channel of the inverse head and shoulder further supports this bullish trend outlook, with Severino’s Ethereum price target likely aligning with the channel’s trajectory.
Ethereum Whale Accumulation Trend Skyrockets
While the Ethereum price is trading at $3,493 after surging by 2.3% in the past 24 hours, an analyst known as ‘Mister Crypto’ revealed that whales have been on a major buying spree.
The analyst shared a chart illustrating Ethereum’s balance on accumulation addresses. He disclosed that Ethereum whales are purchasing ETH tokens exponentially, steadily increasing their holdings since 2017. The sharp rise in accumulation suggests that investors are potentially positioning themselves ahead of a bullish price action.
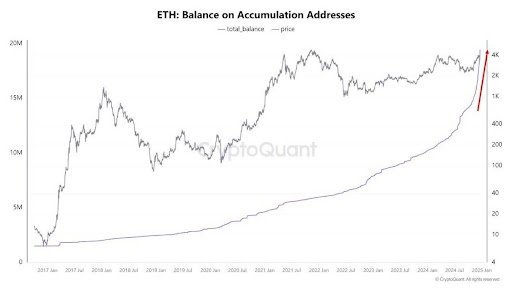
The red arrow in the analyst’s chart also shows a major spike in the ETH balance on accumulation addresses in recent months. Most wallets associated with this surging accumulation have seen minor outflows, signaling long-term holding behavior by investors.
Featured image created with Dall.E, chart from Tradingview.com
Read the full article here


