


Ethereum (ETH), the second-largest cryptocurrency by market capitalization, continues to dominate conversations in the crypto space. With its recent price movements creating ripples of uncertainty, investors are asking: Will ETH drop further, or is a surge just around the corner? By analyzing the provided TradingView charts, we’ll break down the indicators and patterns to help answer this pressing question.
How has the ETH Price Moved Recently?
The current price of Ethereum (ETH) is $3,309.05, with a 24-hour trading volume of $29.86 billion, a market capitalization of $398.65 billion, and a market dominance of 11.88%. Over the past 24 hours, ETH’s price has seen a slight decline of 0.46%.
Ethereum reached its all-time high on November 10, 2021, trading at $4,867.17. In contrast, its all-time low was recorded on October 21, 2015, when it traded at just $0.420897. Following its peak, the lowest price ETH has touched was $897.01 (cycle low), while the highest price since that point was $4,094.18 (cycle high). At the moment, the price prediction sentiment for Ethereum is bearish, while the Fear & Greed Index sits at 50, reflecting a neutral market sentiment.
Ethereum’s circulating supply currently stands at 120.47 million ETH, with an annual supply inflation rate of 0.24%, translating to an addition of 287,841 ETH over the past year.
Daily Chart Overview: Bearish Signals Dominate
ETH/USD Daily Chart- TradingView
Bollinger Bands Indicate Oversold Conditions
The daily chart reveals Ethereum’s price nearing the lower Bollinger Band, a classic sign of bearish pressure. Bollinger Bands measure price volatility, and when the price hovers near the lower band, it often suggests oversold conditions. This doesn’t guarantee an immediate rebound but highlights potential buying opportunities for traders looking for value.
RSI Nears Oversold Territory
The Relative Strength Index (RSI), a popular momentum indicator, sits at 38.52 on the daily timeframe. RSI values below 30 typically signal oversold conditions, while values above 70 indicate overbought conditions. At 38, ETH is approaching a level where buyers might see the asset as undervalued, which could lead to an influx of demand and stabilize the price.
Heikin-Ashi Candles Reflect Bearish Momentum
Heikin-Ashi candles on the daily chart show consecutive red candles with minimal wicks, confirming bearish momentum. The narrow body of recent candles suggests this momentum may be losing strength, signaling a potential turning point if buyers step in.
Key Support and Resistance Levels
- Support at $3,200: This psychological level has held firm during recent price tests. A breach below this could lead to further losses.
- Resistance at $3,360: For a bullish recovery, ETH must break this immediate resistance. Sustained movement above $3,360 could pave the way for a retest of $3,500.
ETH Price Hourly Chart Overview: Early Signs of Stabilization
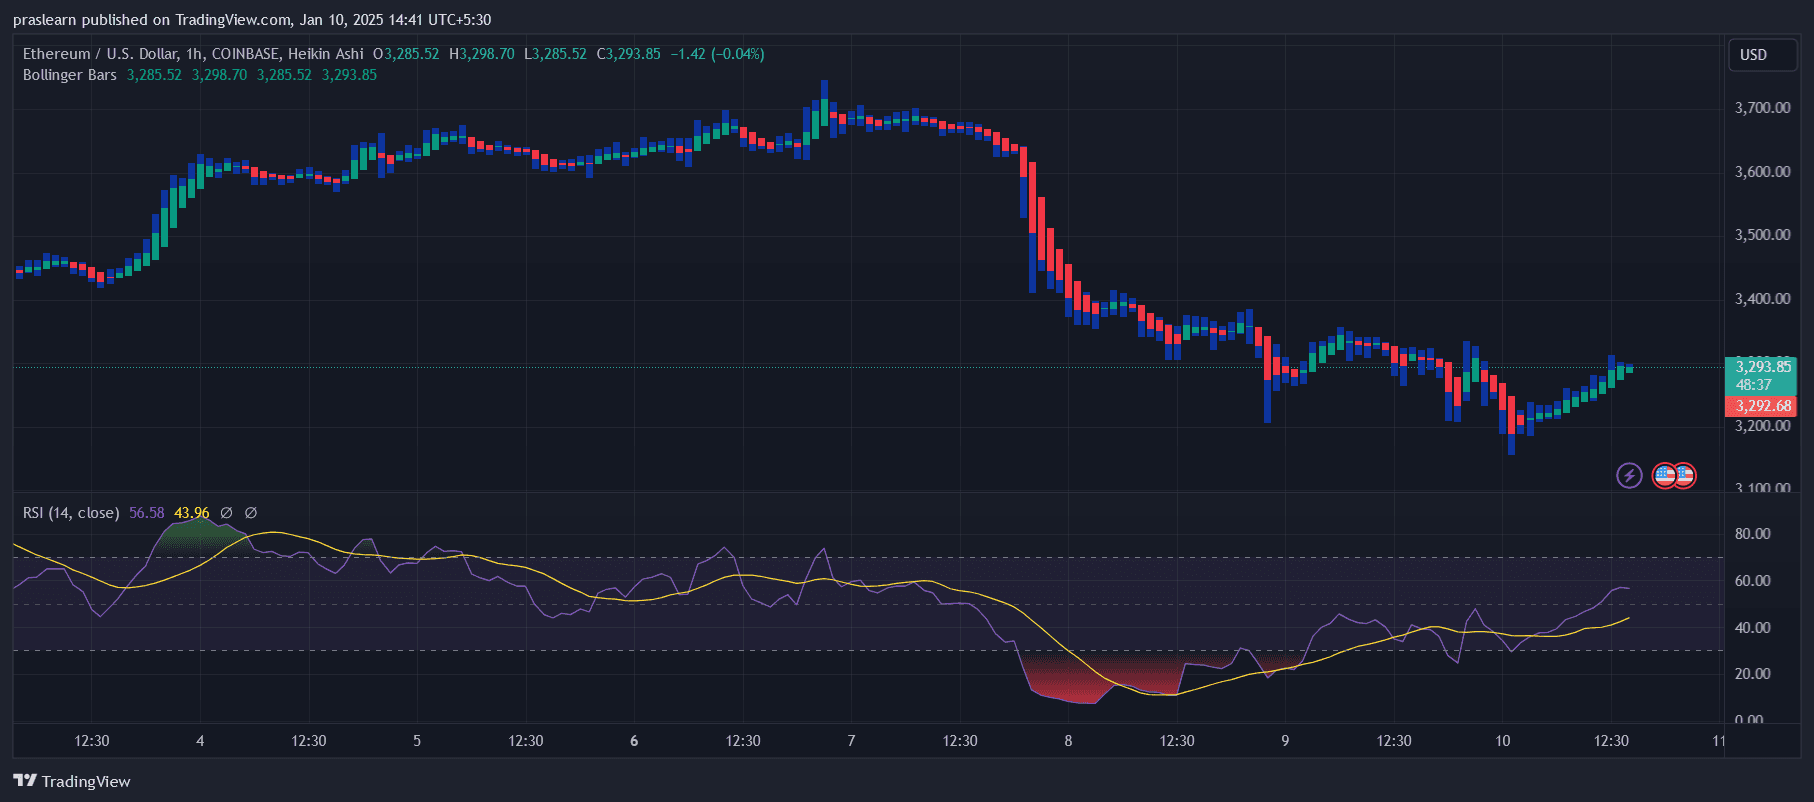
ETH/USD Hourly Chart- TradingView
Short-Term Recovery in Progress
The hourly chart provides a more optimistic view. ETH has bounced back from the lower Bollinger Band and is now flirting with the median line, suggesting a short-term stabilization. The narrowing Bollinger Bands hint at reduced volatility, often a precursor to a decisive price move.
RSI Points to Neutral Momentum
On the hourly chart, the RSI has climbed to 56.58, reflecting a recovery from oversold conditions. This suggests ETH may experience consolidation or a mild upward trend in the short term.
Shift in Heikin-Ashi Candles
Recent green Heikin-Ashi candles with increasing body sizes show a shift toward bullish sentiment. While not definitive, this could be the start of a short-term rally, particularly if buying volume increases.
Ethereum Price Prediction: Decoding Market Sentiment
Bearish Indicators
- Lingering Downward Momentum: On the daily chart, the downward trajectory remains intact, with ETH unable to sustain above $3,360.
- Potential Breakdown: A close below the critical $3,200 support level could trigger panic selling, with the next target around $3,000 or lower.
Bullish Indicators
- Oversold RSI: RSI nearing oversold territory on the daily chart could attract buyers, leading to a relief rally.
- Hourly Recovery: Short-term stabilization on the hourly chart hints at growing buyer interest. If sustained, this could translate into bullish momentum on higher timeframes.
Key Levels to Watch
Support Levels:
- $3,200: A critical level that must hold to avoid a deeper correction.
- $3,000: If $3,200 fails, $3,000 becomes the next significant support.
Resistance Levels:
- $3,360: The immediate hurdle ETH must overcome to confirm short-term bullishness.
- $3,500: A stronger resistance zone that aligns with previous consolidation levels.
Scenarios: Will ETH Drop or Surge?
Bearish Scenario
If Ethereum fails to hold above the $3,200 support, the bears could take control, pushing prices toward $3,000 or even lower. This outcome would likely require external catalysts, such as negative macroeconomic developments or weakness in Bitcoin.
Bullish Scenario
For ETH to rally, it must decisively break above $3,360. This would indicate a reversal of bearish momentum and open the door for a move toward $3,500 or even $3,700. The hourly chart’s early signs of stabilization suggest this is possible, but it will require strong buying volume and improved market sentiment.
Conclusion
Ethereum’s price is currently at a critical juncture. While the daily chart shows bearish dominance, the hourly chart hints at short-term stabilization. The next significant move will depend on whether ETH holds above $3,200 or breaks through $3,360.
- For traders: Monitor the RSI and Bollinger Bands for confirmation of a trend reversal or continuation.
- For long-term investors: Consider the broader market context and ETH’s fundamentals, which remain strong despite short-term price fluctuations.
Ethereum’s next move could set the tone for the broader crypto market, so stay vigilant and be prepared for both scenarios. Whether it’s a drop or a surge, ETH’s volatility is an opportunity for those who trade with a plan.
Read the full article here


