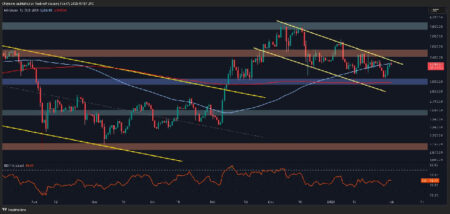
- Ethereum’s price chart shows a falling wedge pattern signaling an upward trend.
- A breakout could push Ethereum toward $3,800, a key resistance level.
- Traders are watching closely as ETH nears a crucial breakout point.
Ethereum, the second-largest cryptocurrency by market capitalization, is signaling a bullish breakout following the formation of a falling wedge pattern on its daily chart. This technical structure, identified by respected analyst CryptoBullet, highlights an exciting opportunity for traders and investors as Ethereum hovers near the $3,391.86 mark.
The Falling Wedge Pattern
The falling wedge is a bullish reversal pattern that often precedes price movements to the upside. As shown on CryptoBullet’s chart, this pattern is formed by two downward-sloping trendlines converging. Ethereum’s price has oscillated within these lines since November 2024, creating lower highs and lows. The decreasing volume during this formation further validates the potential for an impending breakout.
In the current setup, Ethereum’s breakout target is calculated based on the height of the wedge at its widest point. CryptoBullet’s analysis estimates a potential upside of 11.07%, translating to a price increase of $342.57 from the breakout level.
Key Price Levels to Watch
Ethereum has found support around the $3,100 level, as evidenced by multiple touches along the lower trendline of the wedge.
The upper boundary of the wedge, currently near $3,450, serves as the immediate resistance. A decisive break above this level would confirm the breakout and likely propel ETH toward the $3,800 zone.
Ethereum’s Current Momentum
As of February 1, 2025, the token is trading at $3,391.86, positioning itself just below the upper boundary of the falling wedge. This proximity to a hurdle level increases the likelihood of a breakout in the coming days. Traders should monitor the daily close above the trendline for confirmation.
Should Ethereum successfully break out of the falling wedge, the price is expected to rally toward the $3,700-$3,800 range. This move aligns with the projected target of an 11.07% gain. Such a breakout would also mark a recovery for Ethereum, bringing it closer to reclaiming the psychological $4,000 mark.
Broader Market Context
The potential bullish breakout for Ethereum coincides with a renewed interest in the market. Positive macroeconomic developments and increasing adoption of decentralized finance platforms may further fuel the upward trajectory.
The analyst behind this insightful chart has a proven track record of identifying reliable trading setups. Their observation that “ETH loves falling wedges” is well-supported by historical patterns, where Ethereum has demonstrated bullish reversals following similar formations.
Read the full article here


