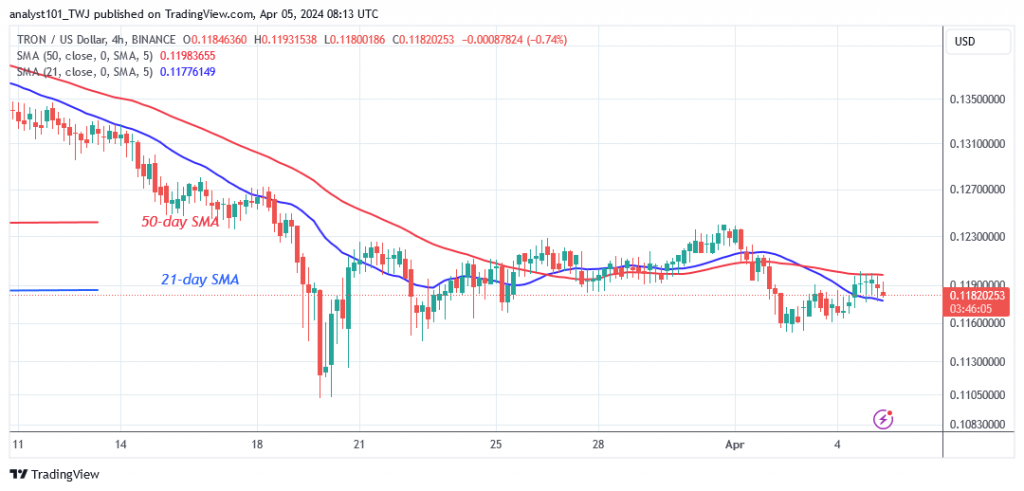
The price of TRON (TRX) recovered from its previous decline until it failed at the $0.144 resistance.
Long-term forecast for the TRX price: bearish
If the cryptocurrency had broken through the $0.144 resistance, it would have entered the bull market. The positive momentum will continue up to the high of $0.219. TRON is currently trading at $0.110, below the high of $0.144.
Since March 19, 2024, the recent dip has held above the $0.110 support level. The bulls bought the dips as the altcoin continued its sideways trend between the $0.110 and $0.124 price levels. TRON will start a new trend once the range level is breached.
TRON indicator reading
TRON’s price bars remain below the moving average lines, although selling pressure has eased above the $0.110 support. The altcoin is showing a bearish crossover with the 21-day SMA falling below the 50-day SMA. The bearish signal has faded as the altcoin resumes its sideways movement.
Technical Indicators
Key supply zones: $0.09, $0.10, $0.11
Key demand zones: $0.06, $0.05, $0.04
What is the next direction for TRON?
Currently, TRON is dropping below the moving average lines. The altcoin is trading in a narrow range of $0.116 to $0.124. On the 4-hour chart, the price bars are embedded between the moving average lines. This means that the altcoin will continue to fluctuate for a few more days.

Disclaimer. This analysis and forecast are the personal opinions of the author and are not a recommendation to buy or sell cryptocurrency and should not be viewed as an endorsement by CoinIdol.com. Readers should do their research before investing in funds.
Read the full article here


