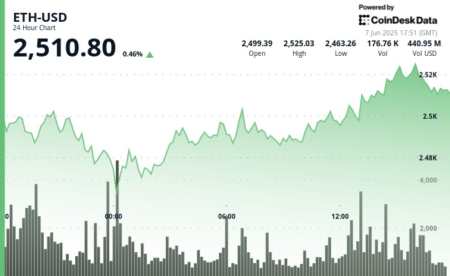
Ethereum is forming a bullish cup-and-handle pattern above its 200-day EMA as it trades around $2,509. Will ETH break out above $3,000?
Ethereum continues to consolidate within a range, maintaining dominance above its 200-day EMA at $2,457. As ETH’s consolidation persists, a bullish cup-and-handle pattern is emerging on the daily chart. Will Ethereum break out of the pattern for an extended rally?
Ethereum Price Analysis
On the daily chart, Ethereum displays a rounding-bottom reversal between February and May, with the neckline aligning with the 61.80% Fibonacci level at $2,712. Currently, Ethereum is moving sideways just below this neckline, supported by the 200-day EMA at $2,457.
The sideways movement and U-shaped reversal complete the rounding-bottom pattern on the daily chart. Furthermore, the reversal has resulted in a bullish crossover between the 50-day and 100-day EMA lines, signaling a potential short-term trend reversal and increasing the chances of a breakout.
At present, Ethereum is trading at $2,509, near the lower boundary of the pattern and the 200-day EMA, while the RSI line continues to decline. This indicates weakening momentum and a hidden bearish divergence, suggesting the possibility of a breakdown.
In such a scenario, the immediate support lies at the 50% Fibonacci level at $2,386, followed by the 38.20% level at $2,098. However, if the broader market recovers, a bullish breakout from the pattern is possible. This could trigger an uptrend toward the 78.60% Fibonacci level at $3,255.
Optimistically, a confirmed breakout could extend the rally toward the 100% Fibonacci level at $4,108.
Derivatives Market Remains Hopeful
Despite the hidden bearish divergence in the RSI hinting at a potential pullback, the bullish chart pattern has sparked increased optimism in the derivatives market. Ethereum open interest has risen by 2.52%, reaching $34.65 billion, with a slightly elevated funding rate of 0.0046%.
Ethereum Derivatives
This suggests growing bullish activity in the market. However, long liquidations have climbed to $25 million over the past 24 hours, while short liquidations remain lower at $15.66 million.
Currently, the long-to-short ratio over the past 24 hours stands at 0.9767, indicating a slight bearish bias in the market.
Read the full article here


