


 Price Stalls Below $0.20 as Golden Cross Nears")
Hedera (HBAR) has been under pressure, down more than 17% over the last 30 days and trading below $0.20 since May 23. While some momentum indicators show early signs of recovery, HBAR continues to face resistance at key technical levels.
Its BBTrend remains in negative territory, and the RSI has failed to break above 60 despite climbing from oversold conditions. A potential golden cross in its EMA lines could trigger a bullish breakout, but the move needs stronger follow-through to overcome nearby resistance.
HBAR’s Persistent Negative BBTrend Could Delay Bullish Breakout
As reflected by its BBTrend indicator, Hedera has shown persistent bearish momentum over the past two weeks. Since May 26, the BBTrend has remained in negative territory, reaching a low of -12.54 on June 2.
As of now, the indicator sits at -0.195, suggesting a potential easing of the downtrend, though the overall sentiment remains weak.
Despite briefly touching 0.09 yesterday, the negative BBTrend trajectory shows that bullish pressure has yet to take hold convincingly.
BBTrend, short for Bollinger Band Trend, measures the direction and strength of price movements based on the position of the price relative to Bollinger Bands.
A positive BBTrend suggests bullish momentum, while a negative reading indicates sustained selling pressure or sideways movement within the lower part of the Bollinger Band range.
With HBAR’s BBTrend still slightly negative at -0.195, it signals caution—although the extreme bearishness seen earlier in June has moderated, the asset hasn’t firmly transitioned into a bullish phase.
HBAR Recovers From Oversold Levels
Hedera is showing signs of recovering momentum, with its Relative Strength Index (RSI) currently at 57.17—up sharply from 27.62 on June 5.
Since June 6, RSI has held consistently above the neutral 50 mark, suggesting buyers gradually gain control.
However, despite this upward shift, HBAR’s RSI has struggled to break above the 60 threshold over the past three days, signaling that bullish momentum remains limited and faces resistance just as it begins to build.
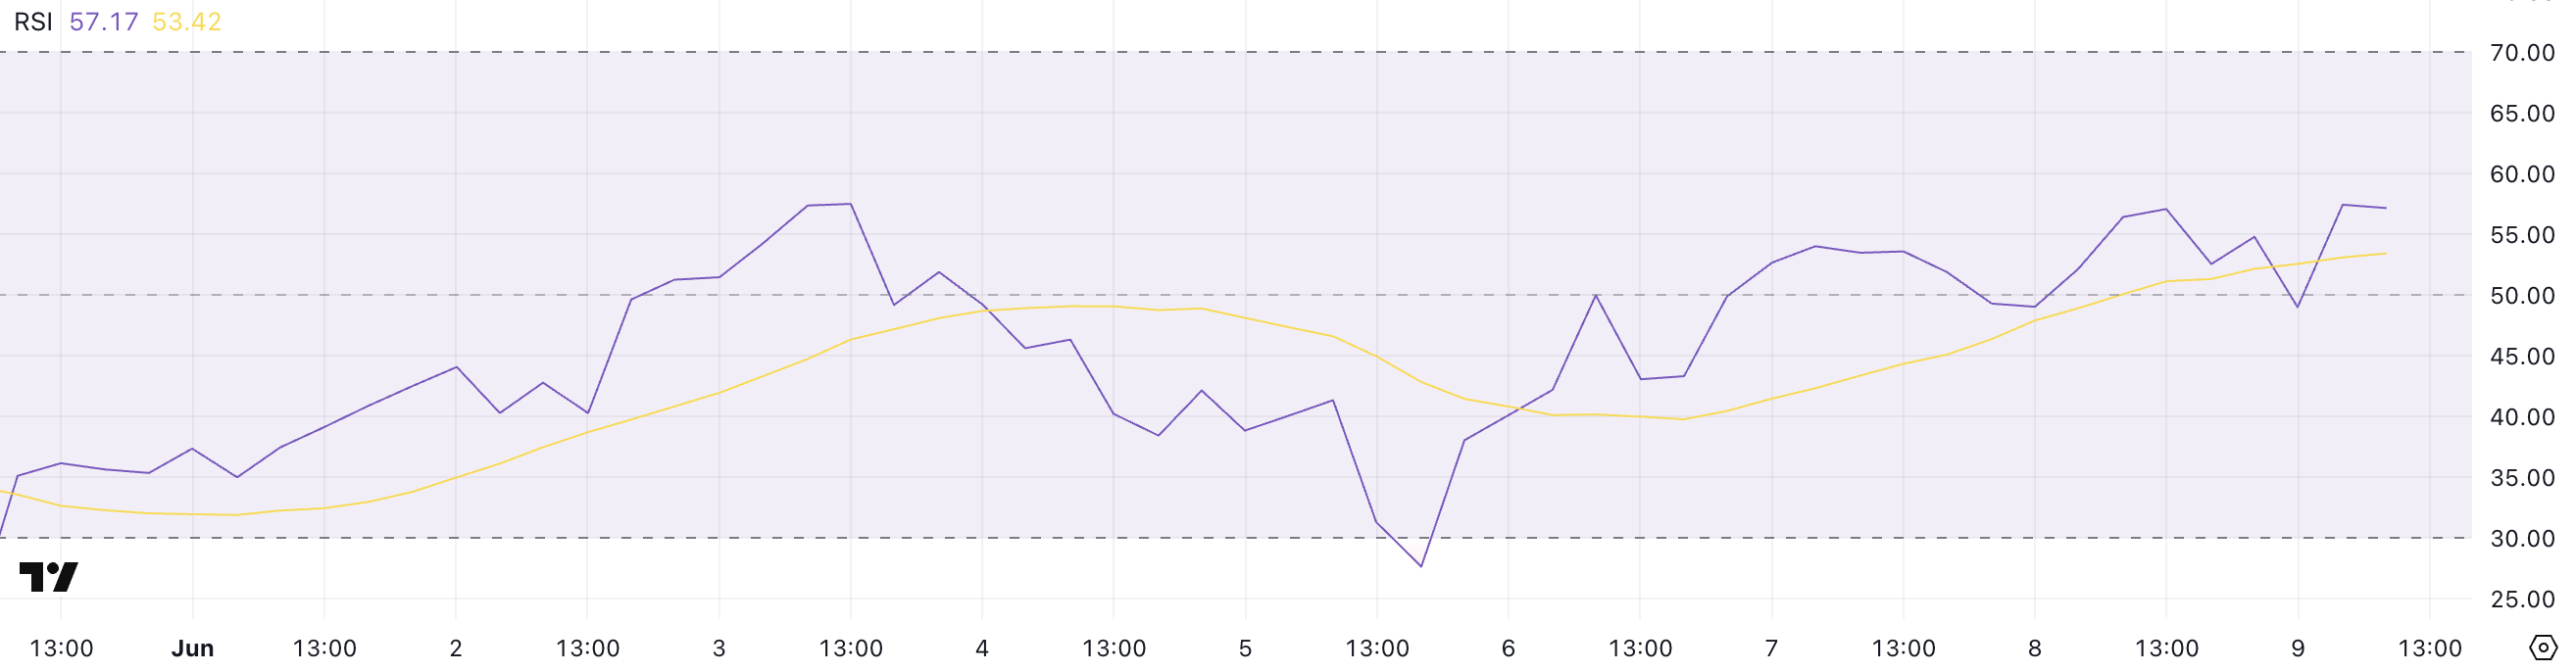
The RSI is a widely used momentum oscillator that ranges from 0 to 100. Values above 70 indicate overbought conditions, while those below 30 point to an oversold market. Readings around 50 suggest a neutral stance.
With HBAR’s RSI currently testing the 50–60 zone, the asset is in a transition phase—neither strongly bullish nor bearish.
A decisive break above 60 could open the door to further upside, but its recent inability shows that the bulls still lack conviction for a sustained rally.
Will Hedera Break $0.20?
Hedera price is approaching an important moment, as its Exponential Moving Averages (EMAs) hint at a potential golden cross formation. This bullish signal occurs when a short-term EMA crosses above a long-term EMA.
If this crossover materializes, it could trigger upward momentum and drive HBAR to test the resistance at $0.175.
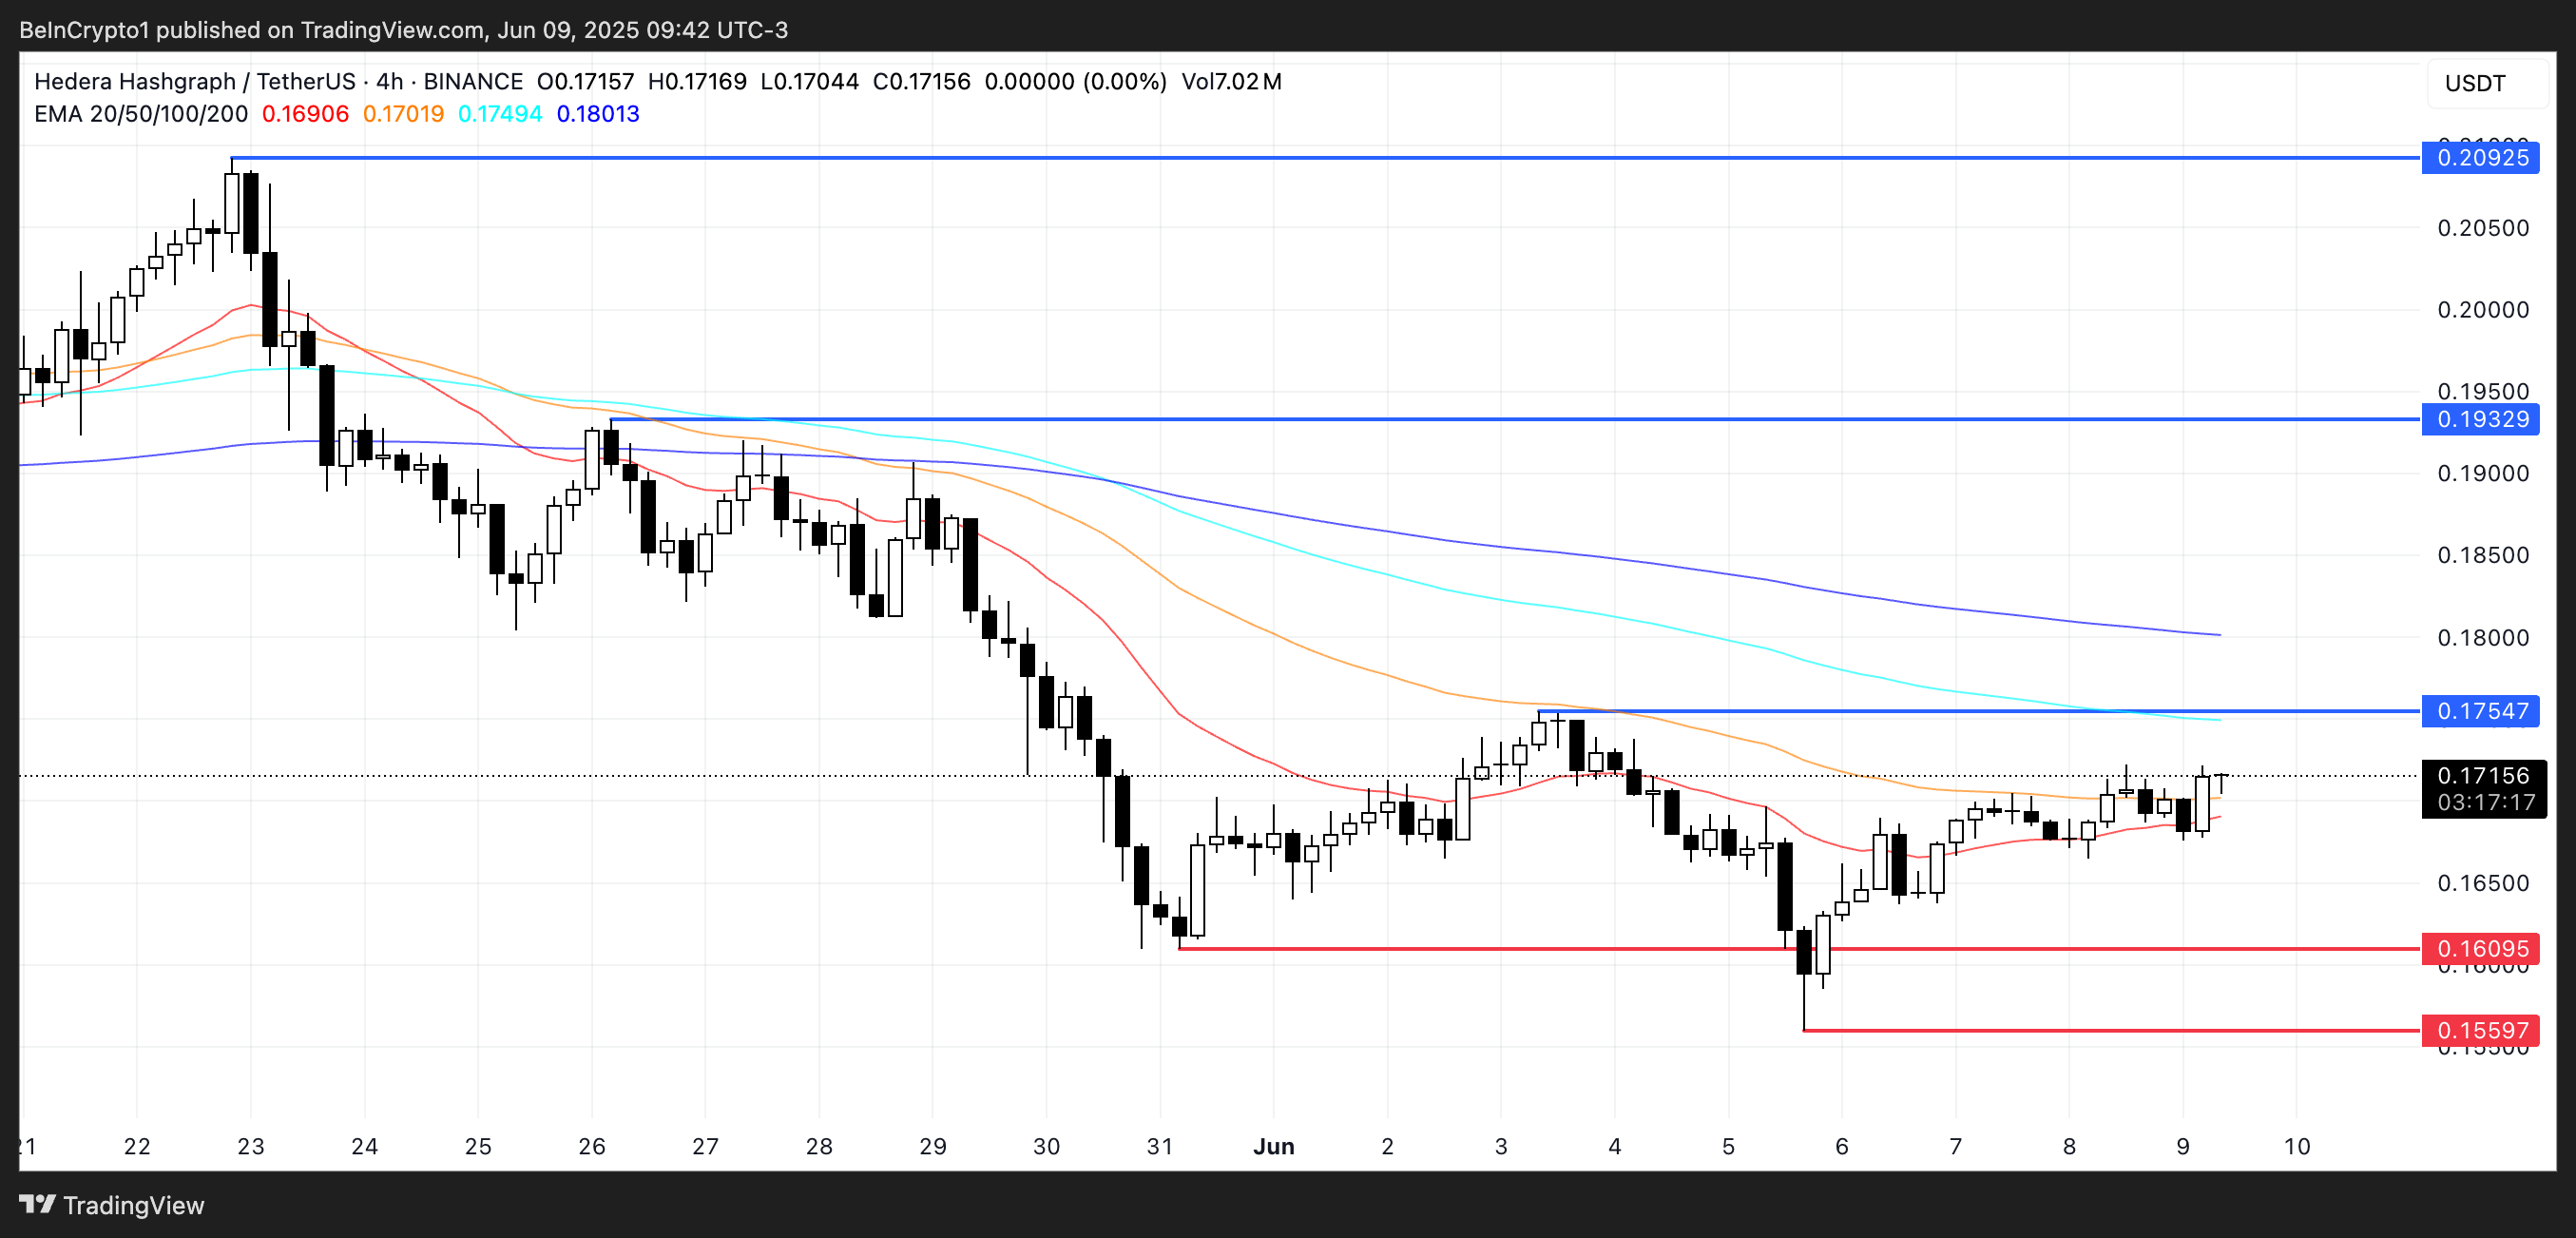
A strong breakout above that level may open the path toward $0.193, and if the uptrend gains traction, HBAR could surge to as high as $0.209, reclaiming the $0.20 zone for the first time since May 23.
However, the bullish scenario hinges on sustained upward momentum. HBAR may retreat to test the immediate support at $0.160 if the rally fails to develop.
A breakdown below that level could drag the price to $0.155, placing it at risk of deeper short-term losses.
Disclaimer
In line with the Trust Project guidelines, this price analysis article is for informational purposes only and should not be considered financial or investment advice. BeInCrypto is committed to accurate, unbiased reporting, but market conditions are subject to change without notice. Always conduct your own research and consult with a professional before making any financial decisions. Please note that our Terms and Conditions, Privacy Policy, and Disclaimers have been updated.
Read the full article here


