 Edging Toward Massive Price Target Amid Maturing Market Structure, According to Trader That Called 2021 Crypto Top")


On June 16, 2025, bitcoin traded within a narrow range, maintaining a steady footing above $106,000 amid cautious optimism in the market. Technical signals from multiple timeframes suggest a neutral-to-bullish outlook, hinging on a breakout above critical resistance levels.
Bitcoin
On the daily chart, bitcoin (BTC) has been consolidating between $105,000 and $107,000 following a sharp correction from a peak of $112,000 to a low of $100,426. This range-bound behavior comes with weakening bullish volume, indicating indecision among market participants. A bearish engulfing pattern combined with red candlesticks on high volume underscores the recent downtrend. However, if bitcoin breaks and closes above $107,500 with conviction, this could reignite bullish momentum, with a potential target between $110,000 and $112,000.
BTC/USD 1-day chart via Bitstamp on June 16, 2025.
The 4-hour chart reflects a short-term bullish structure after bitcoin rebounded from a base near $102,816. Notably, the appearance of a potential double bottom pattern around $102,800 signals a reversal setup. Volume activity during the recent climb supports buying interest, particularly around the $104,000 level. A prudent long entry may lie between $104,000 and $105,000, with resistance expected at $107,500. Profit-taking could be considered around $108,000, assuming momentum sustains.
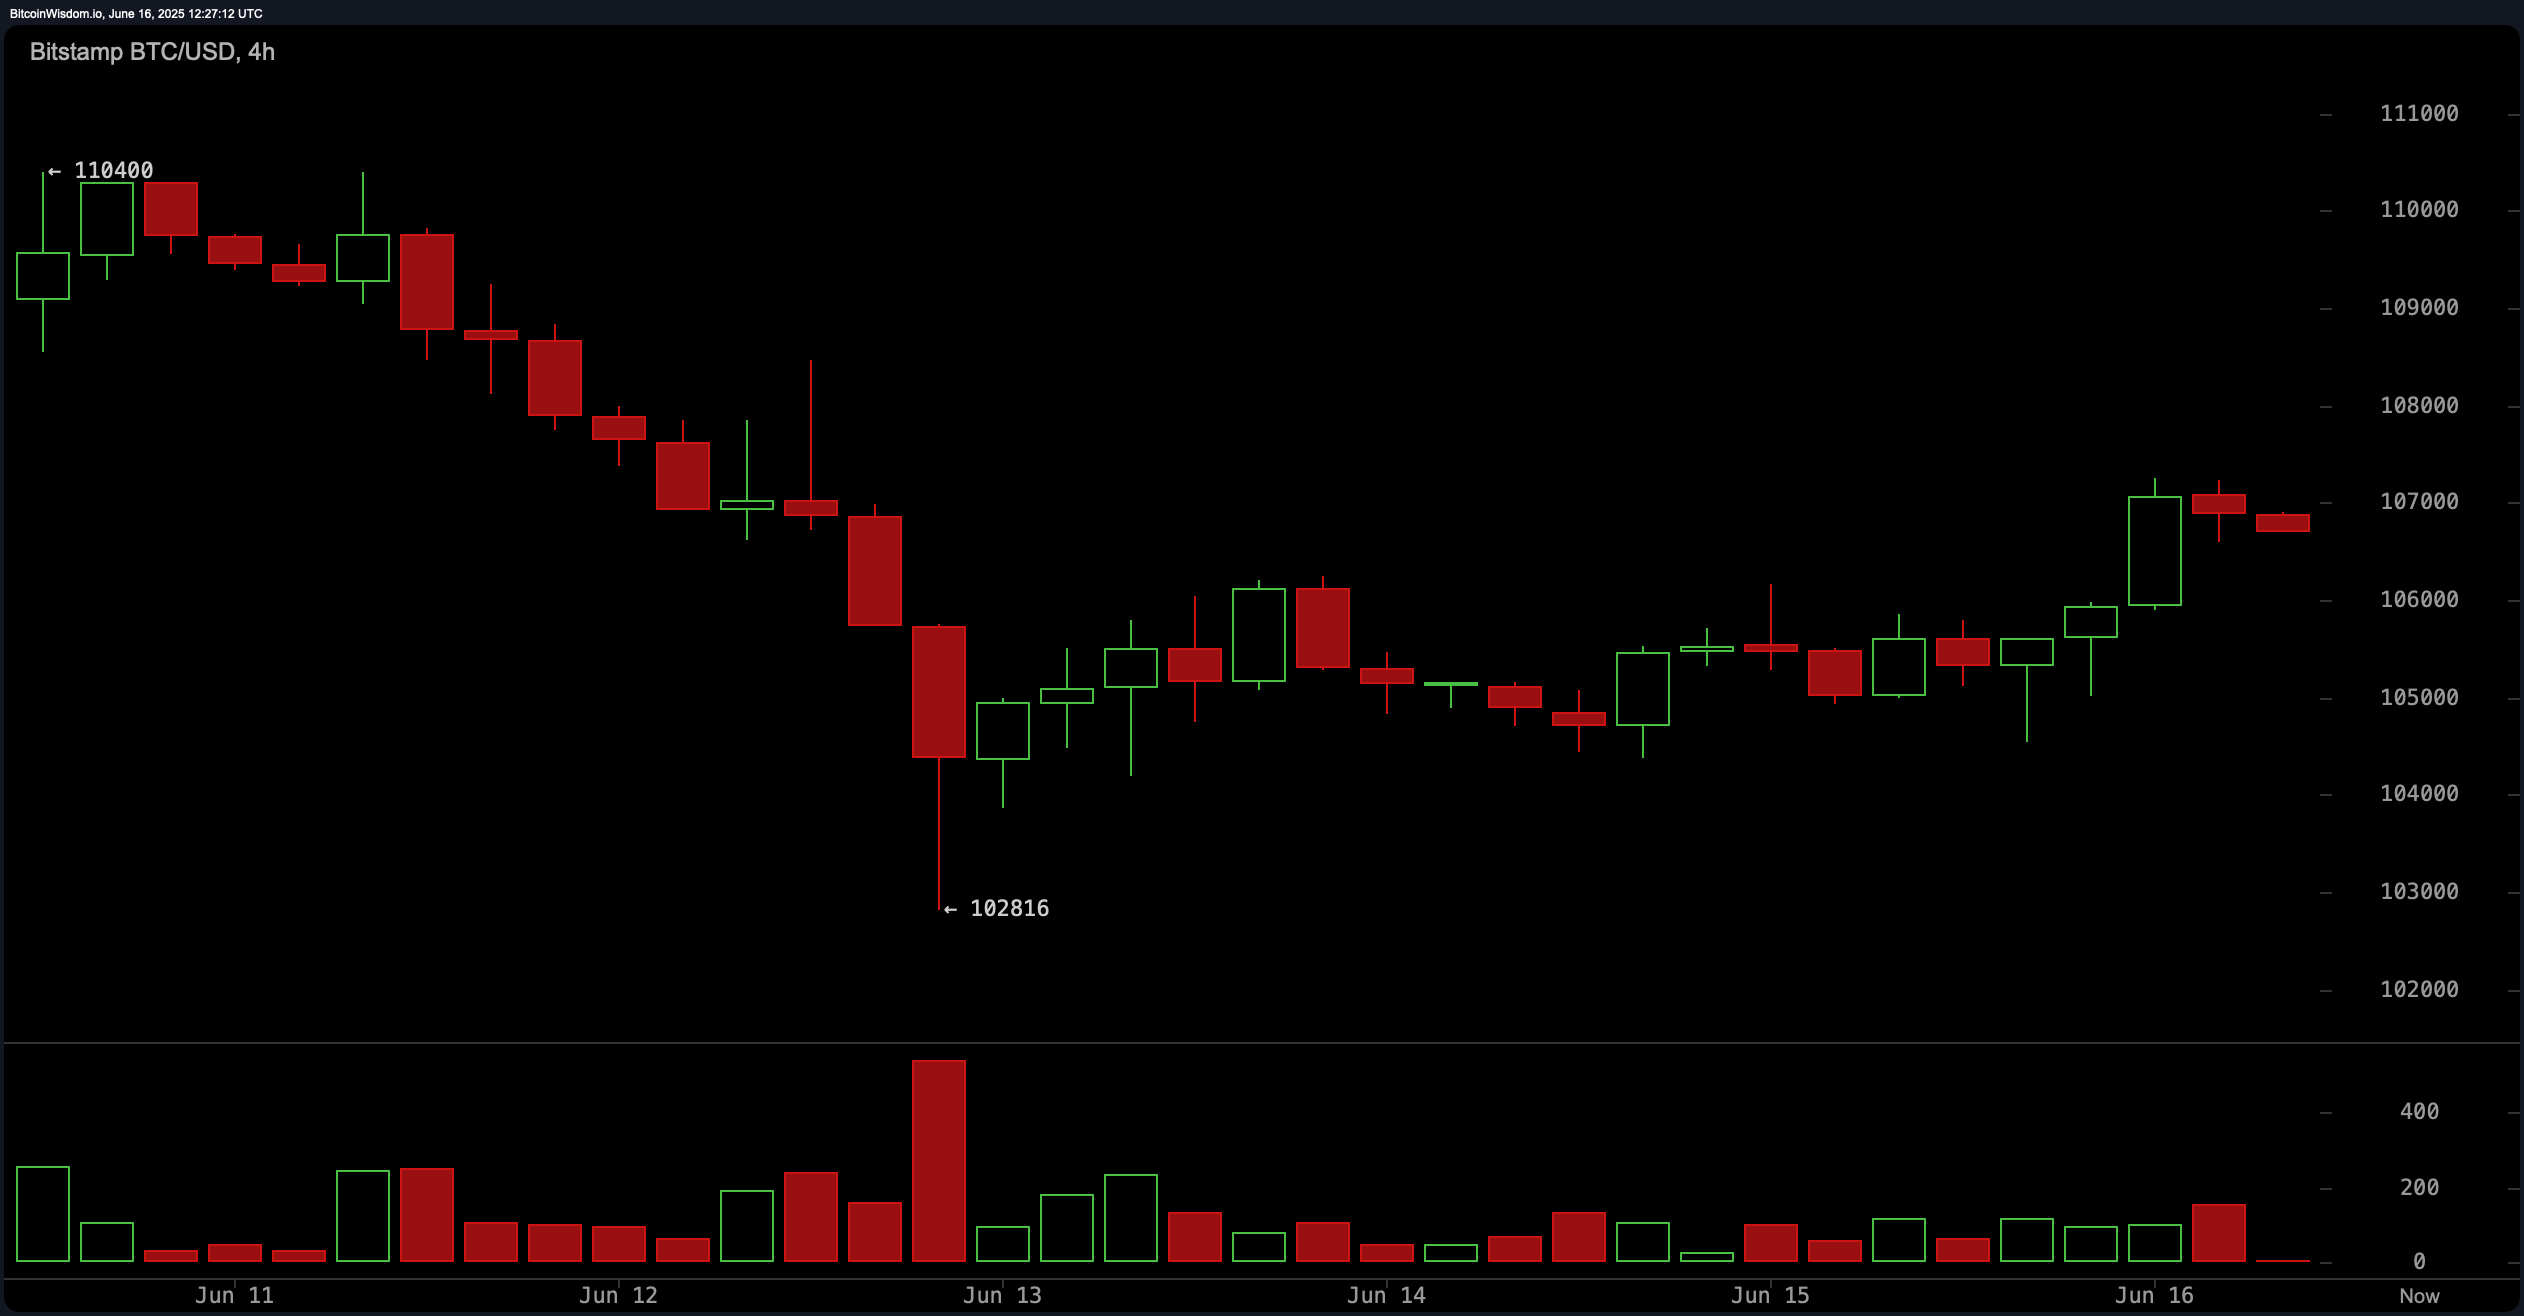
BTC/USD 4-hour chart via Bitstamp on June 16, 2025.
On the 1-hour chart, bitcoin experienced a V-shaped recovery, rallying from $104,532 to a high of $107,251 before entering consolidation. This pattern, possibly forming a bullish flag, indicates room for another upward leg if price action surpasses $107,250. Volume during the rebound reinforces bullish intent. A breakout above this level could drive prices toward $108,500, provided support at $106,000 remains intact.
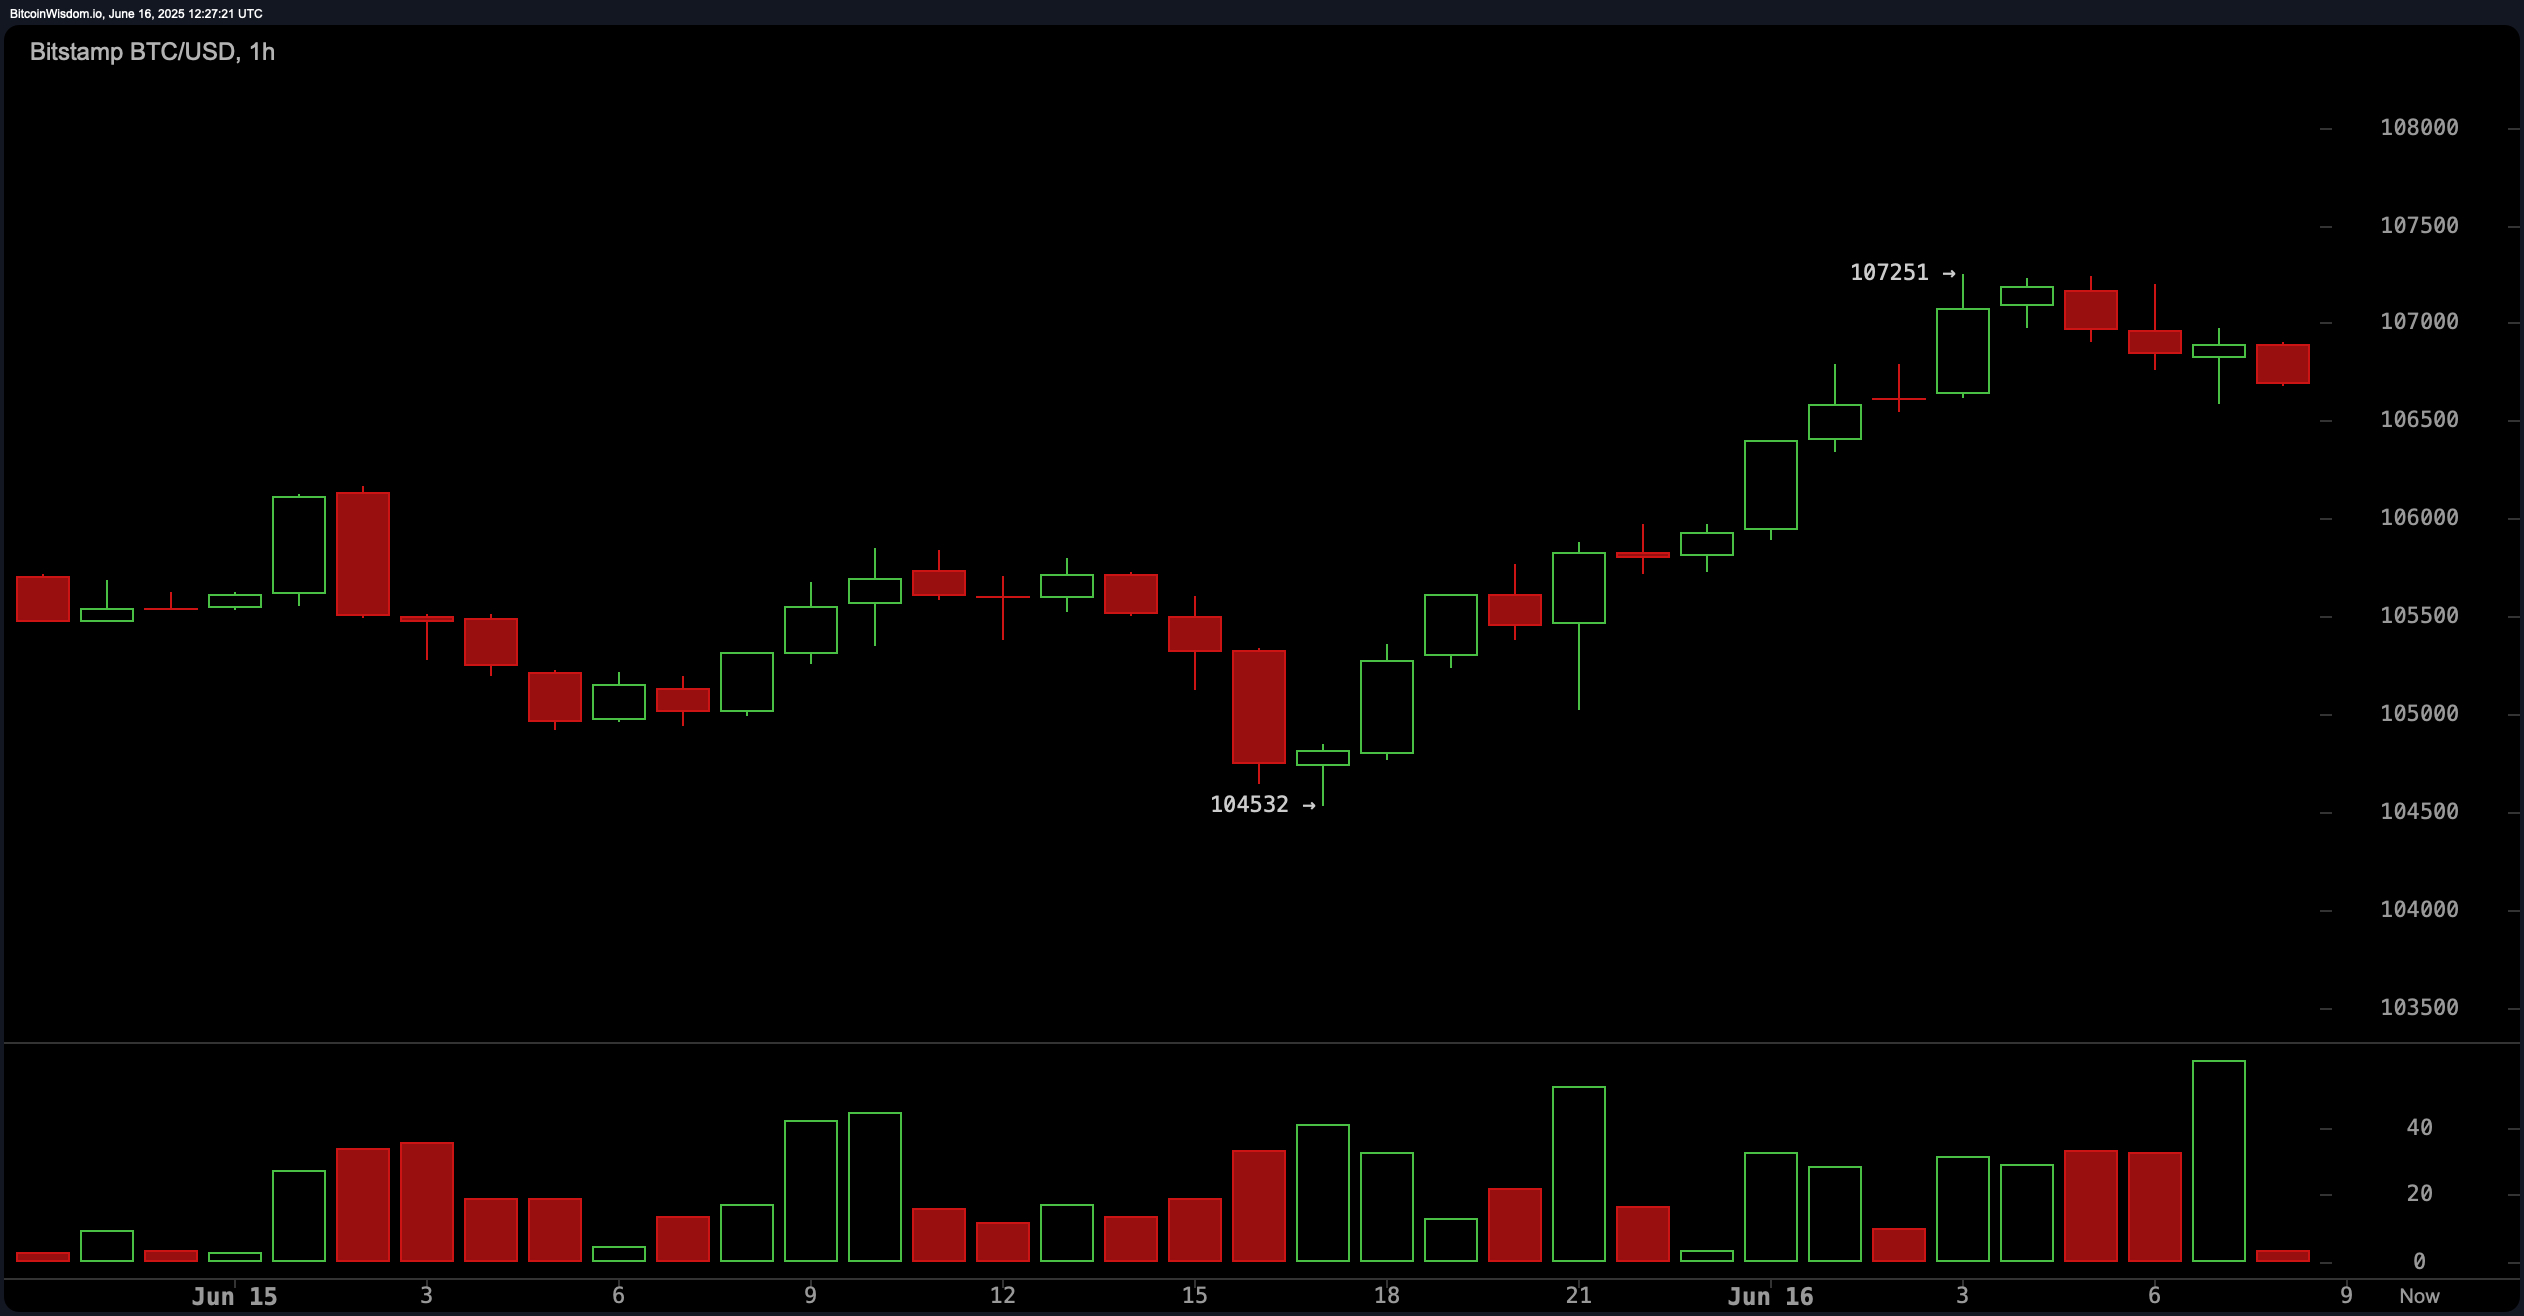
BTC/USD 1-hour chart via Bitstamp on June 16, 2025.
Oscillator readings across key indicators are mixed, reflecting market indecision. The relative strength index (RSI) at 53, Stochastic at 54, and the commodity channel index (CCI) at 20 all show neutral conditions. Meanwhile, the awesome oscillator, momentum, and moving average convergence divergence (MACD) point to a mild bearish bias, each signaling a sell. These divergent signals suggest that traders should await stronger confirmations before taking directional positions.
Moving averages (MAs) offer a slightly more optimistic view. Exponential moving averages (EMAs) for the 10, 20, 30, 50, 100, and 200 periods are all in buy territory, except the 10-period simple moving average (SMA) and 30-period SMA, which show sell signals. This mixed alignment between short- and longer-term averages points to an evolving market structure, where the trend is attempting to shift upward but lacks complete confirmation.
Bull Verdict:
If bitcoin decisively breaks above $107,500 with a surge in volume, it could validate a bullish continuation pattern, potentially targeting the $110,000–$112,000 resistance zone. The alignment of most exponential moving averages and the presence of bullish structures on the 1-hour and 4-hour charts support the case for upward momentum in the short term.
Bear Verdict:
Should bitcoin fail to breach $107,500 and instead slip below the $104,000 support level, bearish momentum may reassert itself. Weak volume during recovery, sell signals from momentum-based oscillators, and recent bearish patterns on the daily chart could indicate a return to the $100,000 support area.
Read the full article here
 Edging Toward Massive Price Target Amid Maturing Market Structure, According to Trader That Called 2021 Crypto Top")


