


Solana (SOL) is down over 11% over the past seven days, as multiple technical indicators point to weakening momentum and growing bearish pressure. The Relative Strength Index (RSI) has fallen sharply, signaling a shift toward a more cautious market stance.
At the same time, both the Ichimoku Cloud and EMA structures show bearish setups, with key resistance levels holding firm and support zones now at risk. Unless a clear reversal takes shape, SOL may continue facing downward pressure in the short term.
Solana RSI Drops Below 45 as Momentum Fades
Solana’s Relative Strength Index (RSI) has dropped to 40.77, a notable decline from 64.25 just two days ago.
This sharp shift reflects weakening bullish momentum and suggests that recent selling pressure has outpaced buying interest.
The move down signals a potential transition from neutral or bullish conditions into a more cautious or bearish sentiment zone, as traders begin reassessing Solana’s short-term outlook.
The RSI is a widely used momentum indicator that measures the speed and magnitude of recent price changes. It ranges from 0 to 100, with readings above 70 typically indicating overbought conditions—often preceding price pullbacks—while values below 30 suggest oversold conditions, potentially signaling price rebounds.
A reading near 40.77 places Solana in a neutral-to-weak zone, hinting that the asset is losing upward momentum but hasn’t yet reached oversold territory.
If RSI continues to decline, it could indicate further downside risk, while stabilization above 40 might suggest consolidation before the next move.
Bearish Ichimoku Structure Keeps SOL Under Pressure
Solana’s Ichimoku Cloud chart reveals a bearish setup. Price action is currently trading below the Kumo (cloud), which is shaded red.
This red cloud indicates prevailing downward momentum and acts as dynamic resistance. The Leading Span A (green line forming the upper edge of the cloud) remains below Leading Span B (red line forming the lower edge), reinforcing the bearish structure.
The cloud ahead also stays red and relatively thick, suggesting strong overhead resistance soon and making a bullish reversal more difficult unless significant momentum builds.
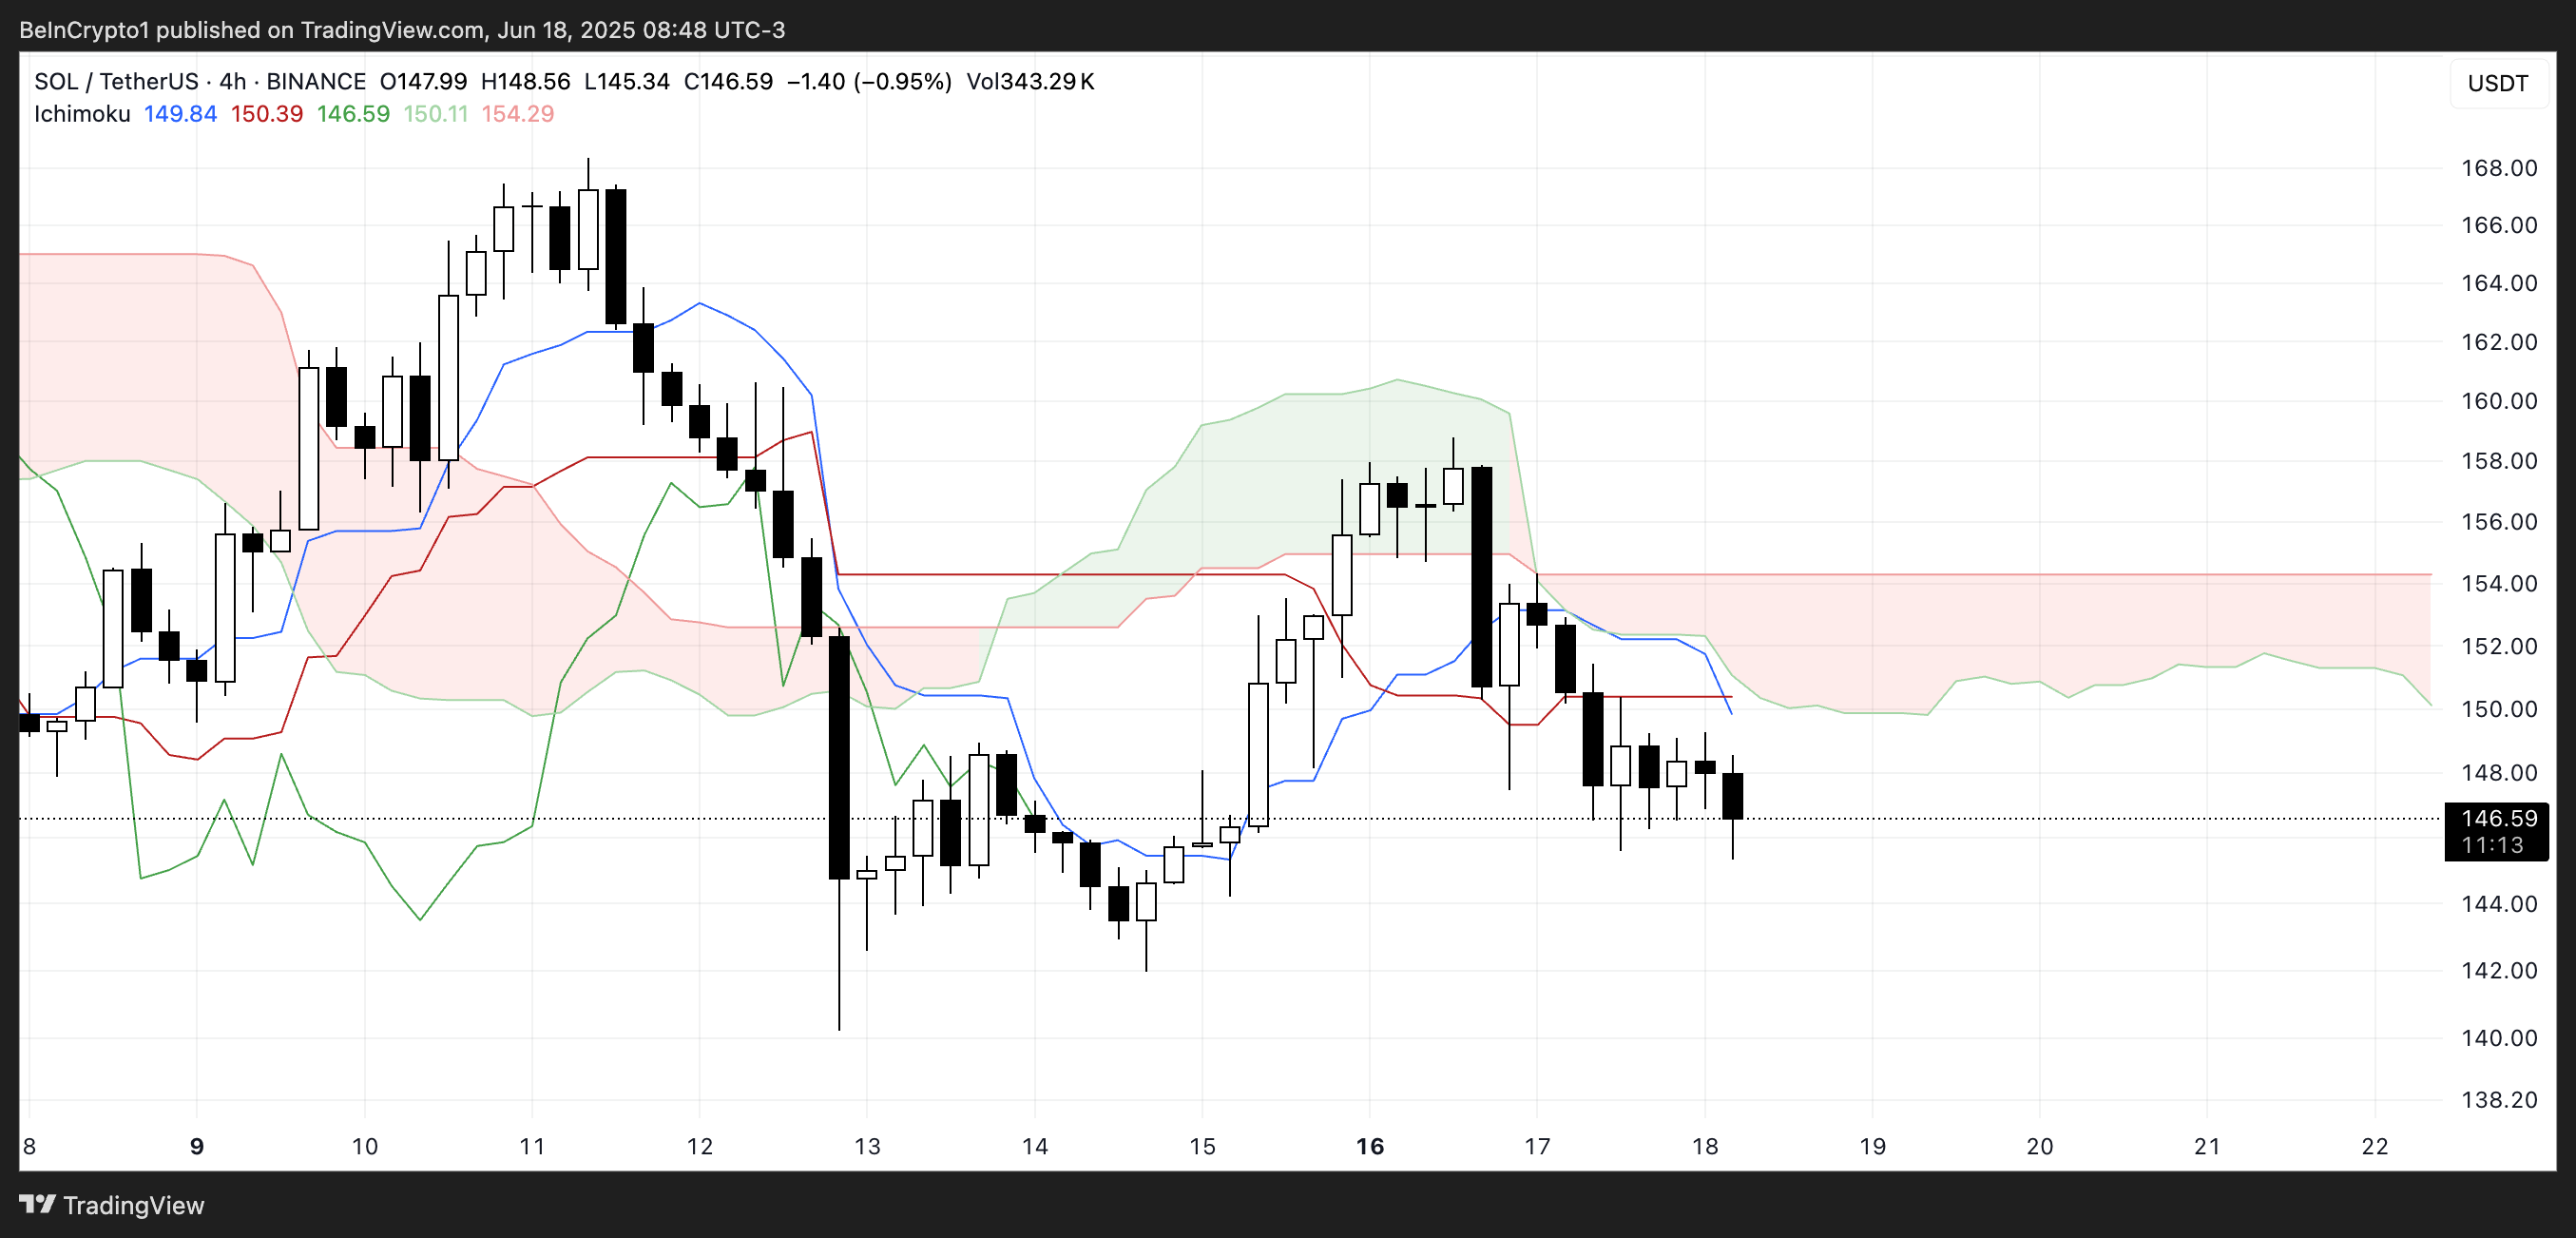
The Tenkan-sen (blue line) is currently below the Kijun-sen (red line), another classic bearish signal. These two lines have also flattened out, signaling consolidation rather than any strong directional movement.
With candles struggling to break above the Tenkan-sen, short-term momentum appears weak.
Unless a bullish crossover occurs or price action penetrates the cloud, Solana remains under bearish pressure from an Ichimoku standpoint.
Solana EMA Structure Remains Bearish Despite Recent Rebound Attempt
Solana’s EMA structure remains bearish, with shorter-term moving averages positioned below the longer-term ones—signaling continued downward momentum.
This setup emerged after a failed bullish attempt two days ago, where SOL tried to reverse the trend but faced rejection. If the bearish alignment holds, the asset could test its immediate support level at $141.53.
A breakdown below that could open the door to further downside, potentially pushing SOL below $140 for the first time since April 21.
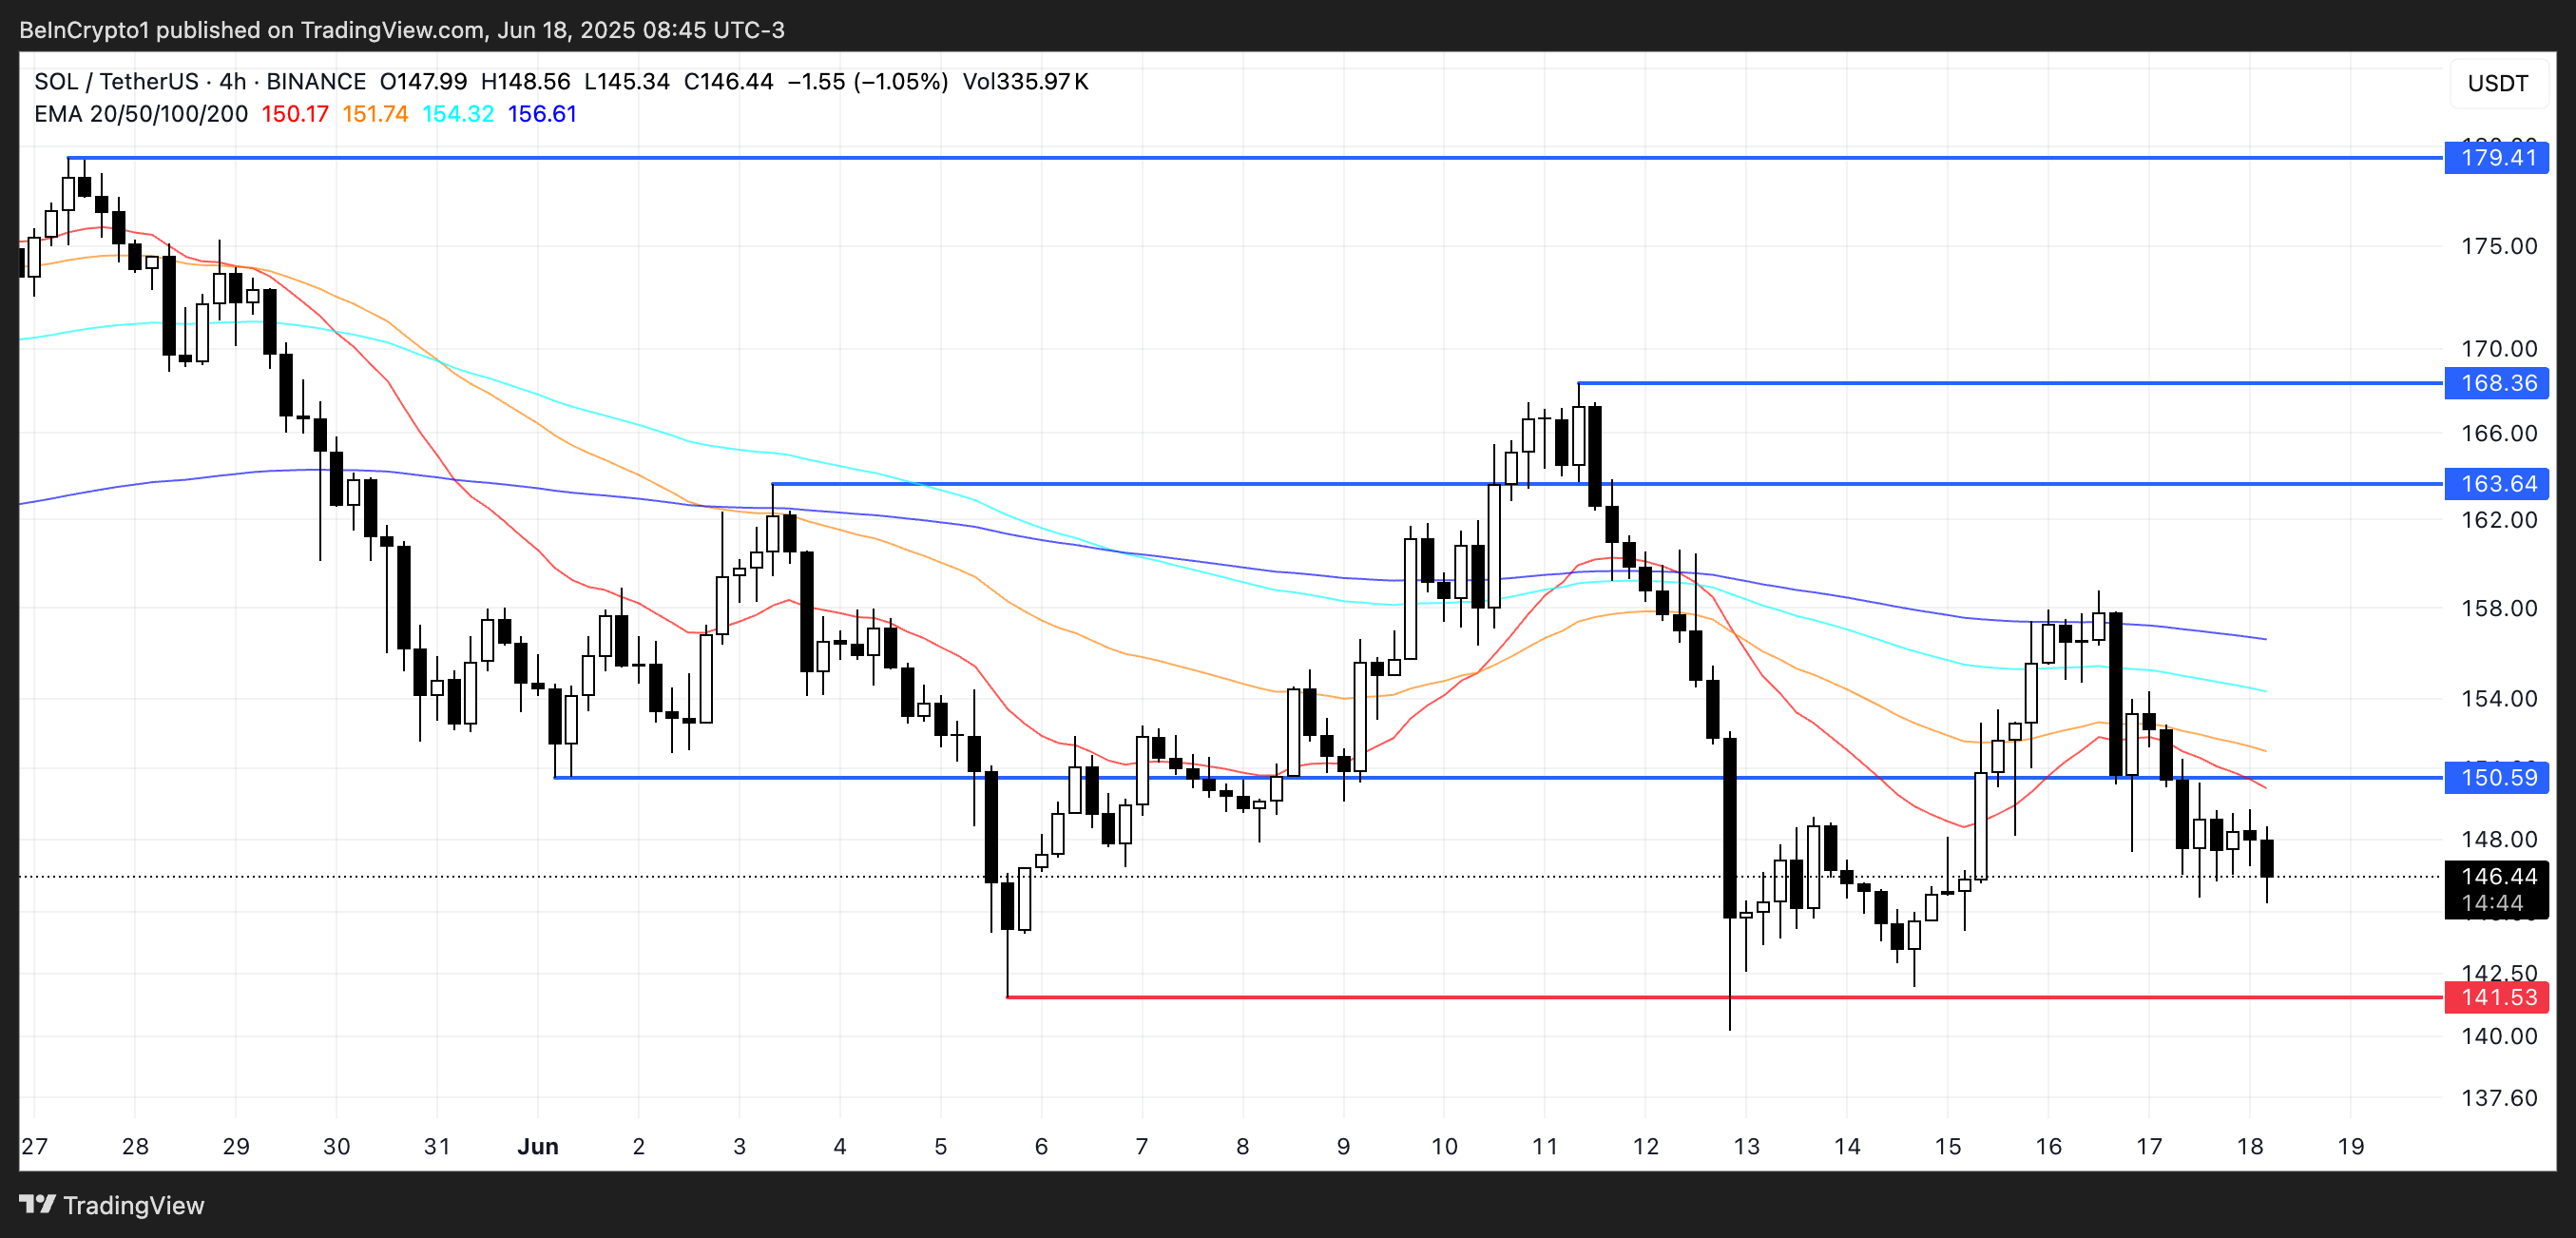
On the flip side, if the trend reverses and short-term EMAs begin to curve upward, Solana could retest the resistance zone around $150.59.
A clean break above this level would be the first sign of a potential trend shift. If buying momentum strengthens beyond that, higher resistance targets lie at $163.64 and $168.36.
In the case of an extended rally, SOL might even aim for $179.41 as the next major upside level.
Disclaimer
In line with the Trust Project guidelines, this price analysis article is for informational purposes only and should not be considered financial or investment advice. BeInCrypto is committed to accurate, unbiased reporting, but market conditions are subject to change without notice. Always conduct your own research and consult with a professional before making any financial decisions. Please note that our Terms and Conditions, Privacy Policy, and Disclaimers have been updated.
Read the full article here


