Key takeaways:
-
Declining daily active and new addresses signal reduced network activity, less demand for XRP.
-
XRP open interest is down 30% in a month.
-
XRP price is stuck below key trendlines as a classic pattern hints at a drop to $1.20.
XRP’s (XRP) price has been consolidating within a tight $2.05-$2.33 range over the last 30 days as $3.00 remains elusive. Key data points explain why XRP price is stuck in a consolidation, including XRP Ledger’s declining network activity, decreasing open interest and weak technicals.
Declining XRP Ledger network activity
The XRP Ledger has experienced a significant drop in network activity over the last six months. Onchain data from Glassnode shows new daily addresses on the network are far below the 2025 peak of 15,823 reached on Jan. 16. Only 3,500 new addresses were created on Thursday.
Similarly, the network’s number of daily active addresses (DAAs) sharply dropped to 34,360 on Thursday from a 3-month high of 577,000 on Saturday, signaling reduced interest or a lack of confidence in XRP’s near-term outlook.
Related: Analyst: Prepare for a 530% XRP price breakout to $14 if this happens

Historically, declines in network activity typically signal upcoming price stagnation or drops, as lower transaction volume reduces liquidity and buying momentum.
Decreasing OI reflects XRP price stagnation
XRP’s inability to reach $3 is reinforced by decreasing open interest (OI), as per data from CoinGlass.
The chart below shows that XRP OI has dropped by 30% to $3.89 billion from $5.53 billion, suggesting that investors are closing positions with the expectation of XRP price moving lower.

Historically, significant drops in OI interest have preceded declines in XRP price. For example, the current scenario mirrors the XRP price decline in January, leading to a 53% drop to a multimonth low of $1.61 on April 7 from a multi-year high of $3.40 in January.
XRP price suppressed by moving averages
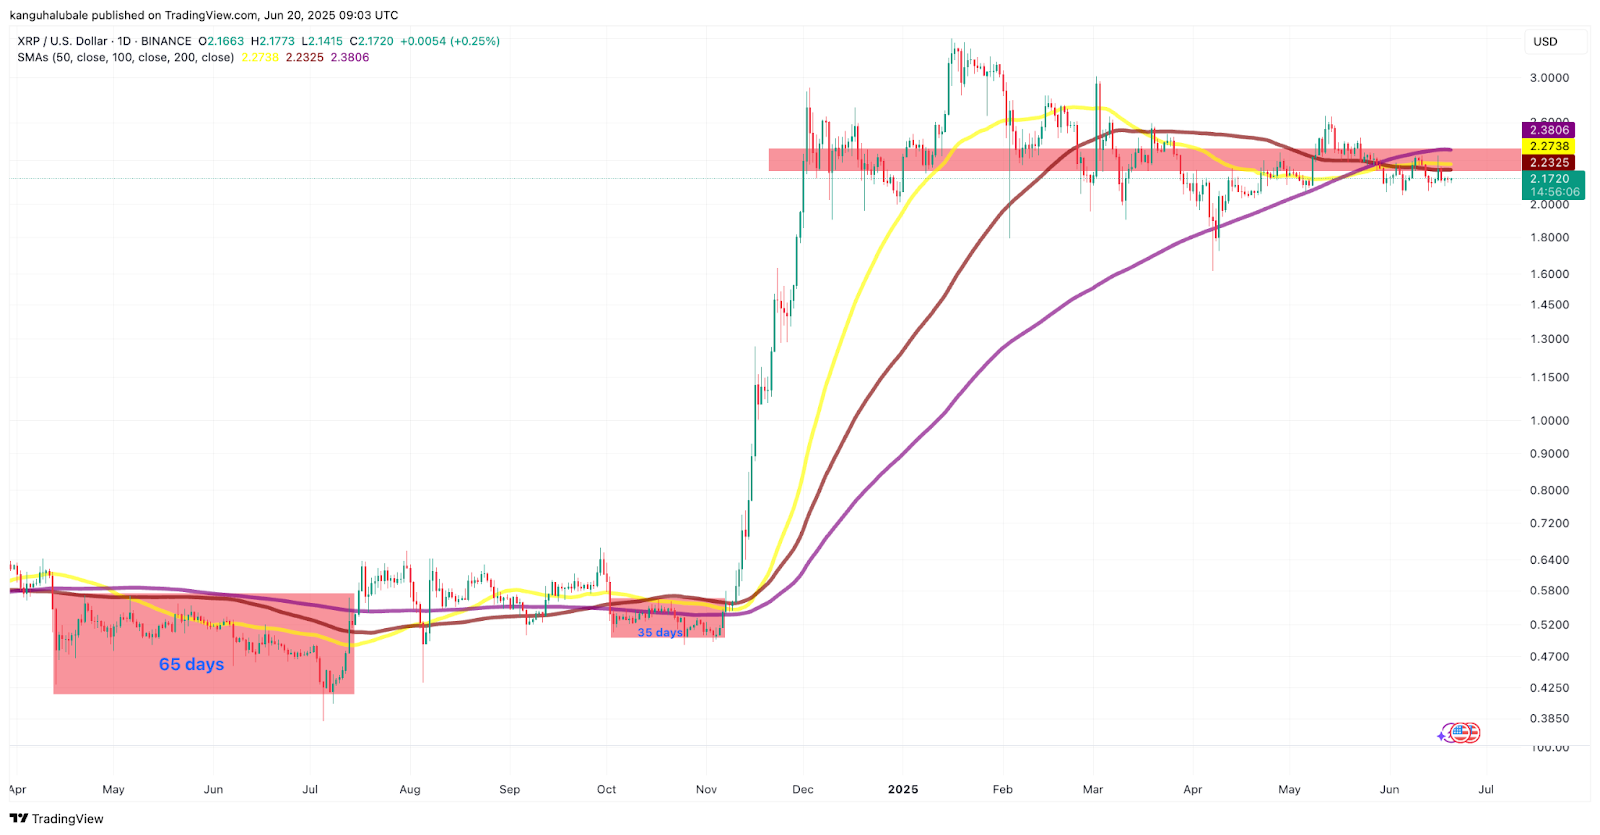
Data from Cointelegraph Markets Pro and TradingView shows that the XRP price is stuck below a key resistance zone between $2.22 and $2.40. This is where all the major simple moving averages (SMAs) currently sit.
If XRP bulls do not push the price above the SMAs, the altcoin may consolidate below these trendlines for a few more weeks. The last two times XRP price broke below these trendlines, it traded sideways for 30 and 65 days and then swept lower levels before breaking upward, as shown in the chart below.

“XRP price continues to struggle with the $2.25 level,” said XRP trader and analyst CasiTrades in a Wednesday post on X, adding:
“As long as this remains resistance, it increases the likelihood that we’ll sweep the lower levels: $2.01, $1.90, even $1.55 are still on the table.”
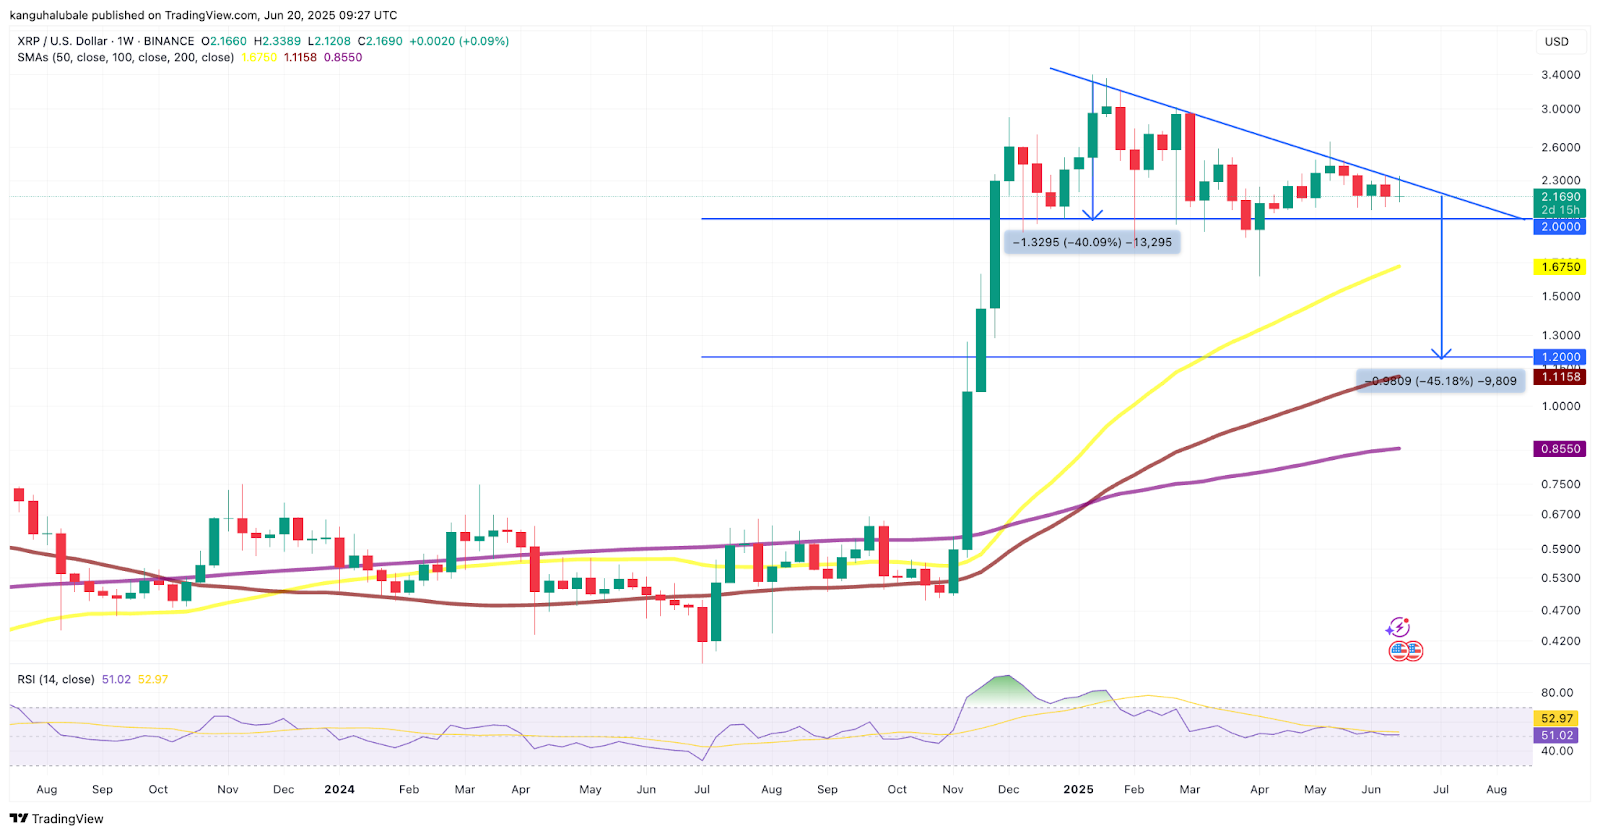
This aligns with a descending triangle analysis, which indicates a potential 45% drop toward $1.20 if the support at $$2.00 is lost.

The RSI has dropped to 51 from overbought conditions at 81 on Jan. 20, indicating increasing bearish momentum.
Alternatively, XRP’s 200-day consolidation below $3 could be a precursor for a massive upward move to $10, similar to the one that preceded a strong breakout in 2017.
This article does not contain investment advice or recommendations. Every investment and trading move involves risk, and readers should conduct their own research when making a decision.
Read the full article here


