Ethereum has entered a consolidation phase after a strong rally in the last couple of months. The price has been ranging between key support and resistance zones, with multiple failed attempts to break above the $2,700–$2,800 region.
Despite the lack of immediate trend continuation, on-chain fundamentals such as exchange reserves hint at significant structural shifts. This sets the stage for potential volatility ahead as the market prepares for its next directional move.
Technical Analysis
By ShayanMarkets
The Daily Chart
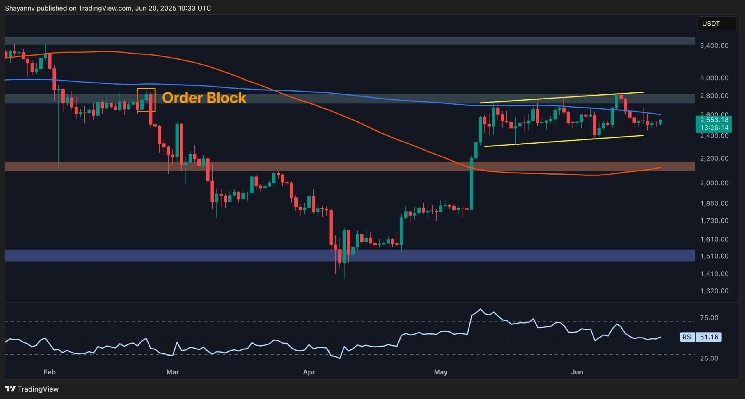
On the daily timeframe, ETH remains inside an ascending channel, consistently finding support around the $2,400 area while struggling to break above the $2,800 mark.
The upper boundary of this channel, combined with the 200-day moving average and a key order block formed in February, is acting as a heavy resistance element. Each test of this level has led to a rejection, but so far, the structure hasn’t broken down, indicating that bulls are still in control for now.
Momentum, however, is weakening. The RSI hovers around the midline at 51, reflecting indecision and a lack of strong directional drive. If ETH can reclaim the upper range and flip the $2,700–$2,800 area into support, it could initiate a new leg higher toward $3,000 and above. On the flip side, a breakdown below $2,400 would shift the bias bearish, exposing the $2,150 support zone.
The 4-Hour Chart
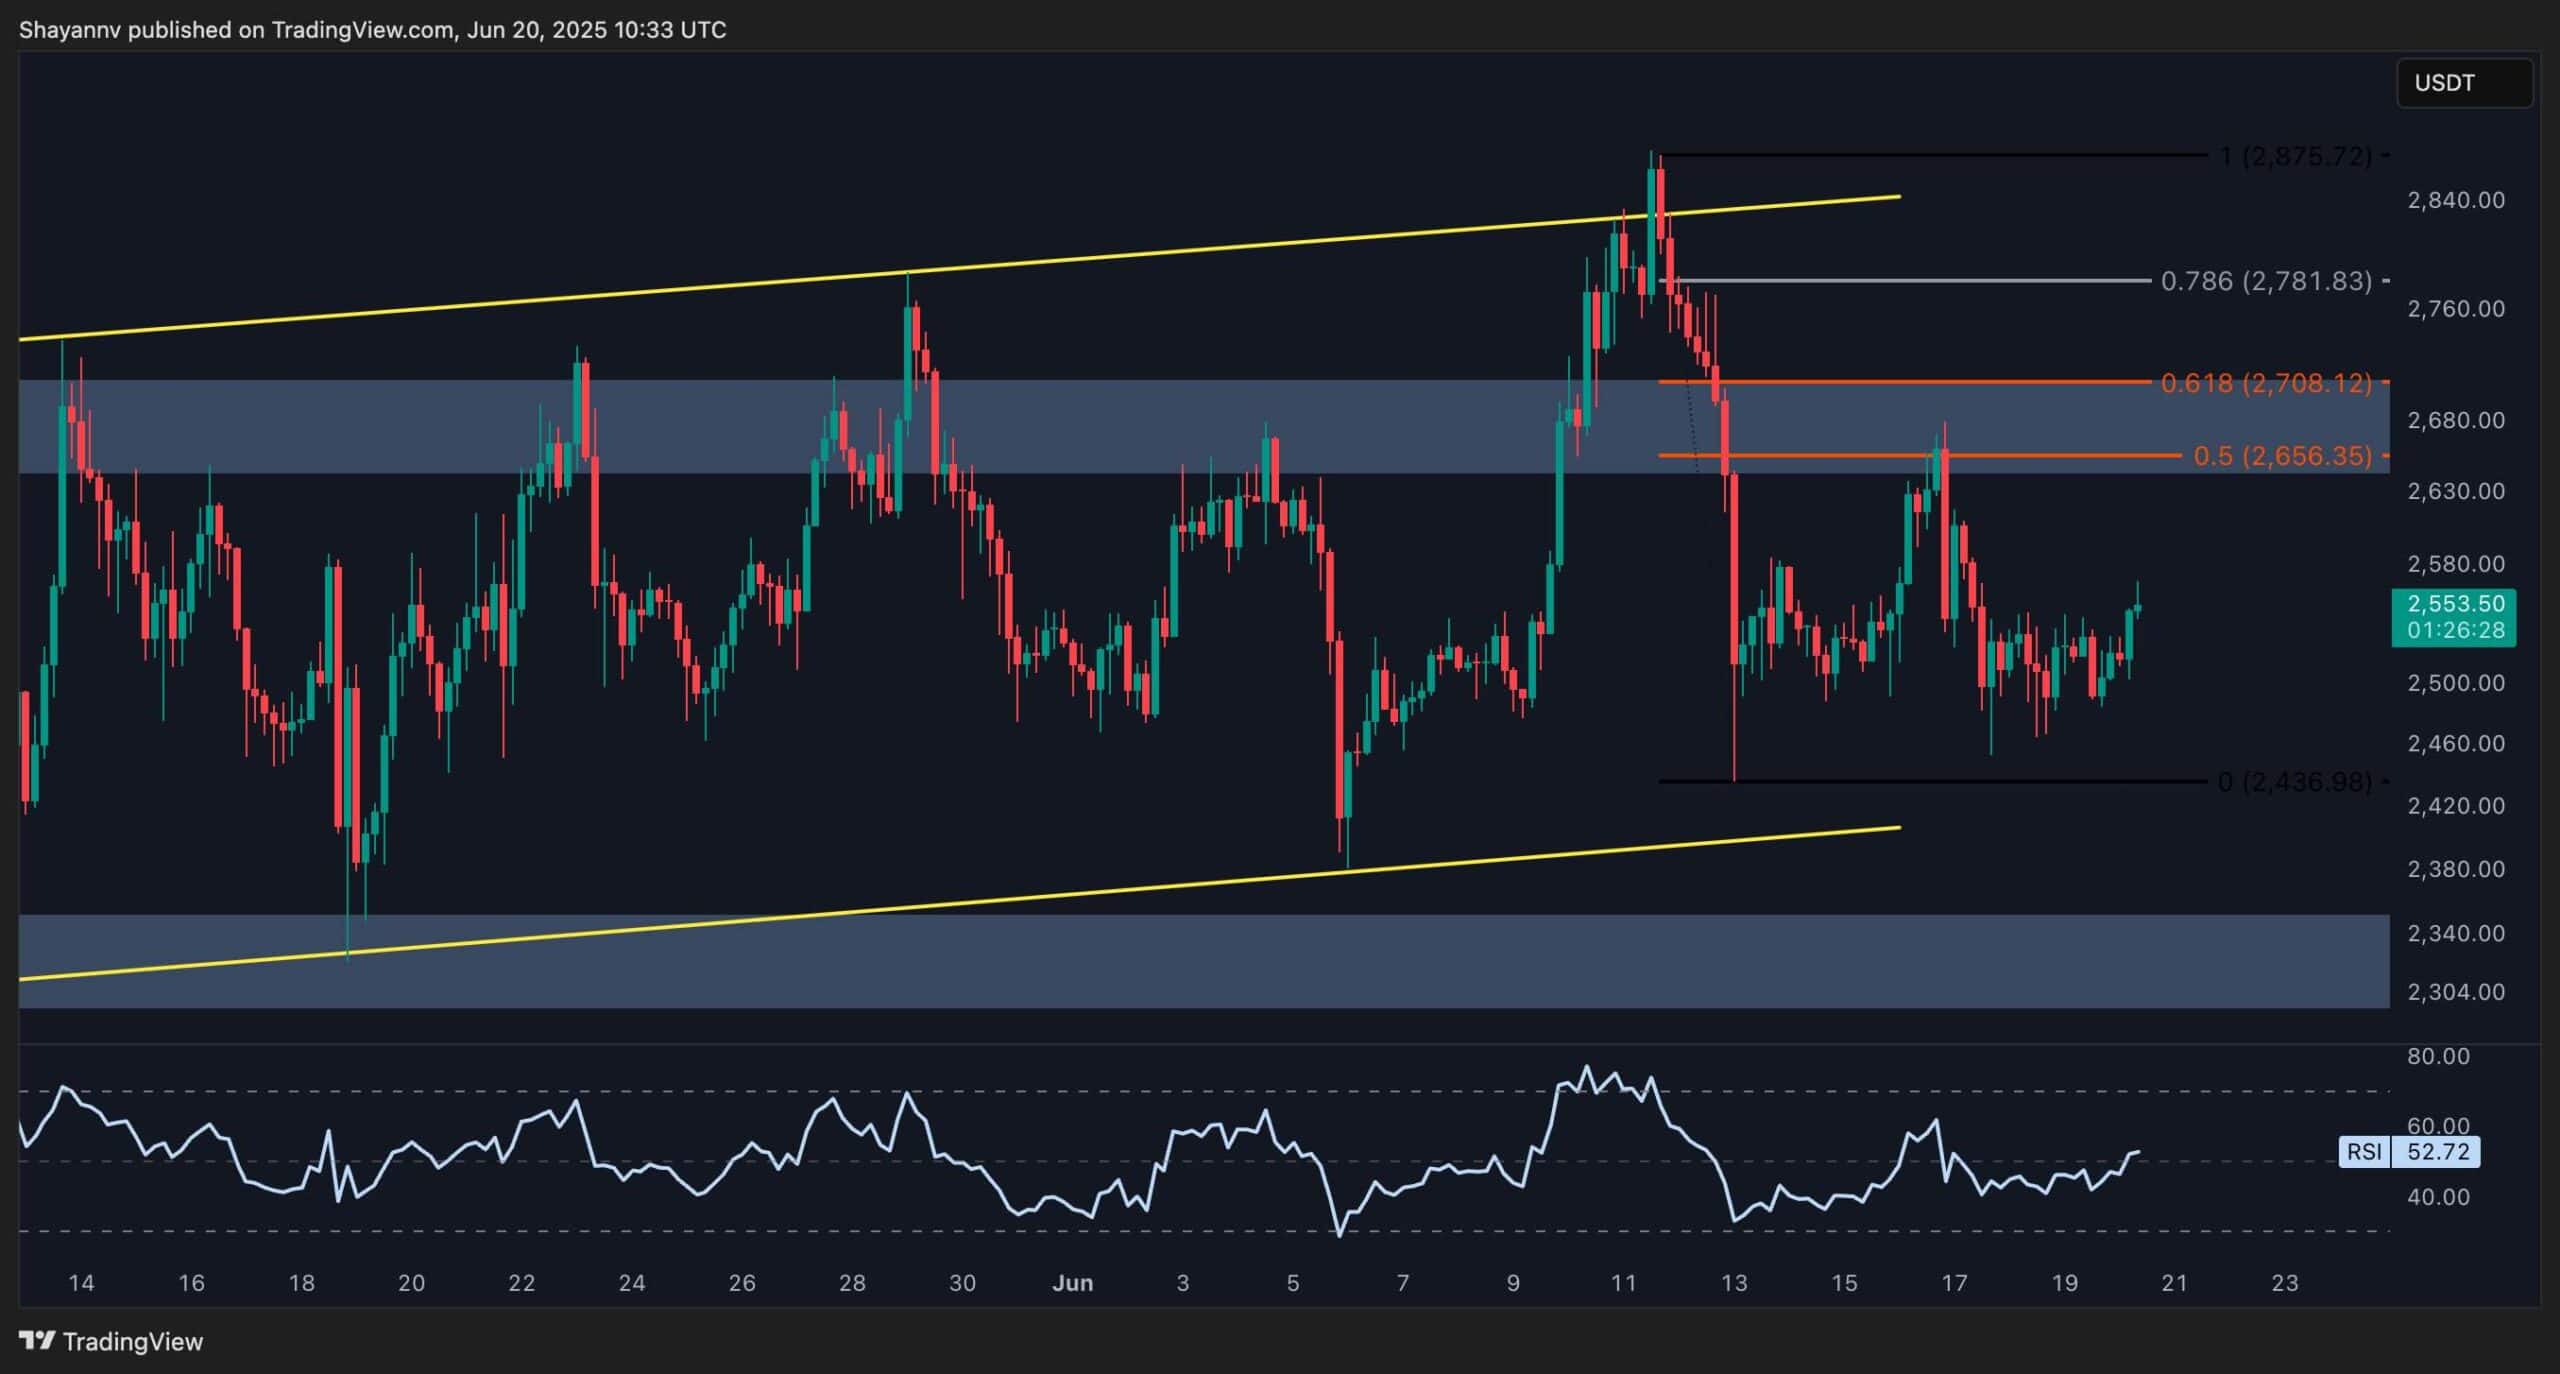
Zooming in on the 4H chart, ETH is still grinding within the same rising channel. After the recent drop from $2,875 to $2,430, the price retraced into the 0.5–0.618 Fibonacci zone, but has been rejected to the downside and is now consolidating below it. This area, between $2,600 and $2,700, has repeatedly acted as a supply zone, rejecting bullish attempts multiple times. For short-term traders, this remains the key level to flip.
Until this resistance breaks, ETH may continue its range-bound behavior. The RSI has recovered slightly from oversold conditions, now sitting near 52. While this suggests a slight uptick in momentum, there’s still no clear sign of bullish dominance. If the bulls fail to break above this key fib zone soon, another drop toward the lower boundary of the channel near $2,400 is likely.
Sentiment Analysis
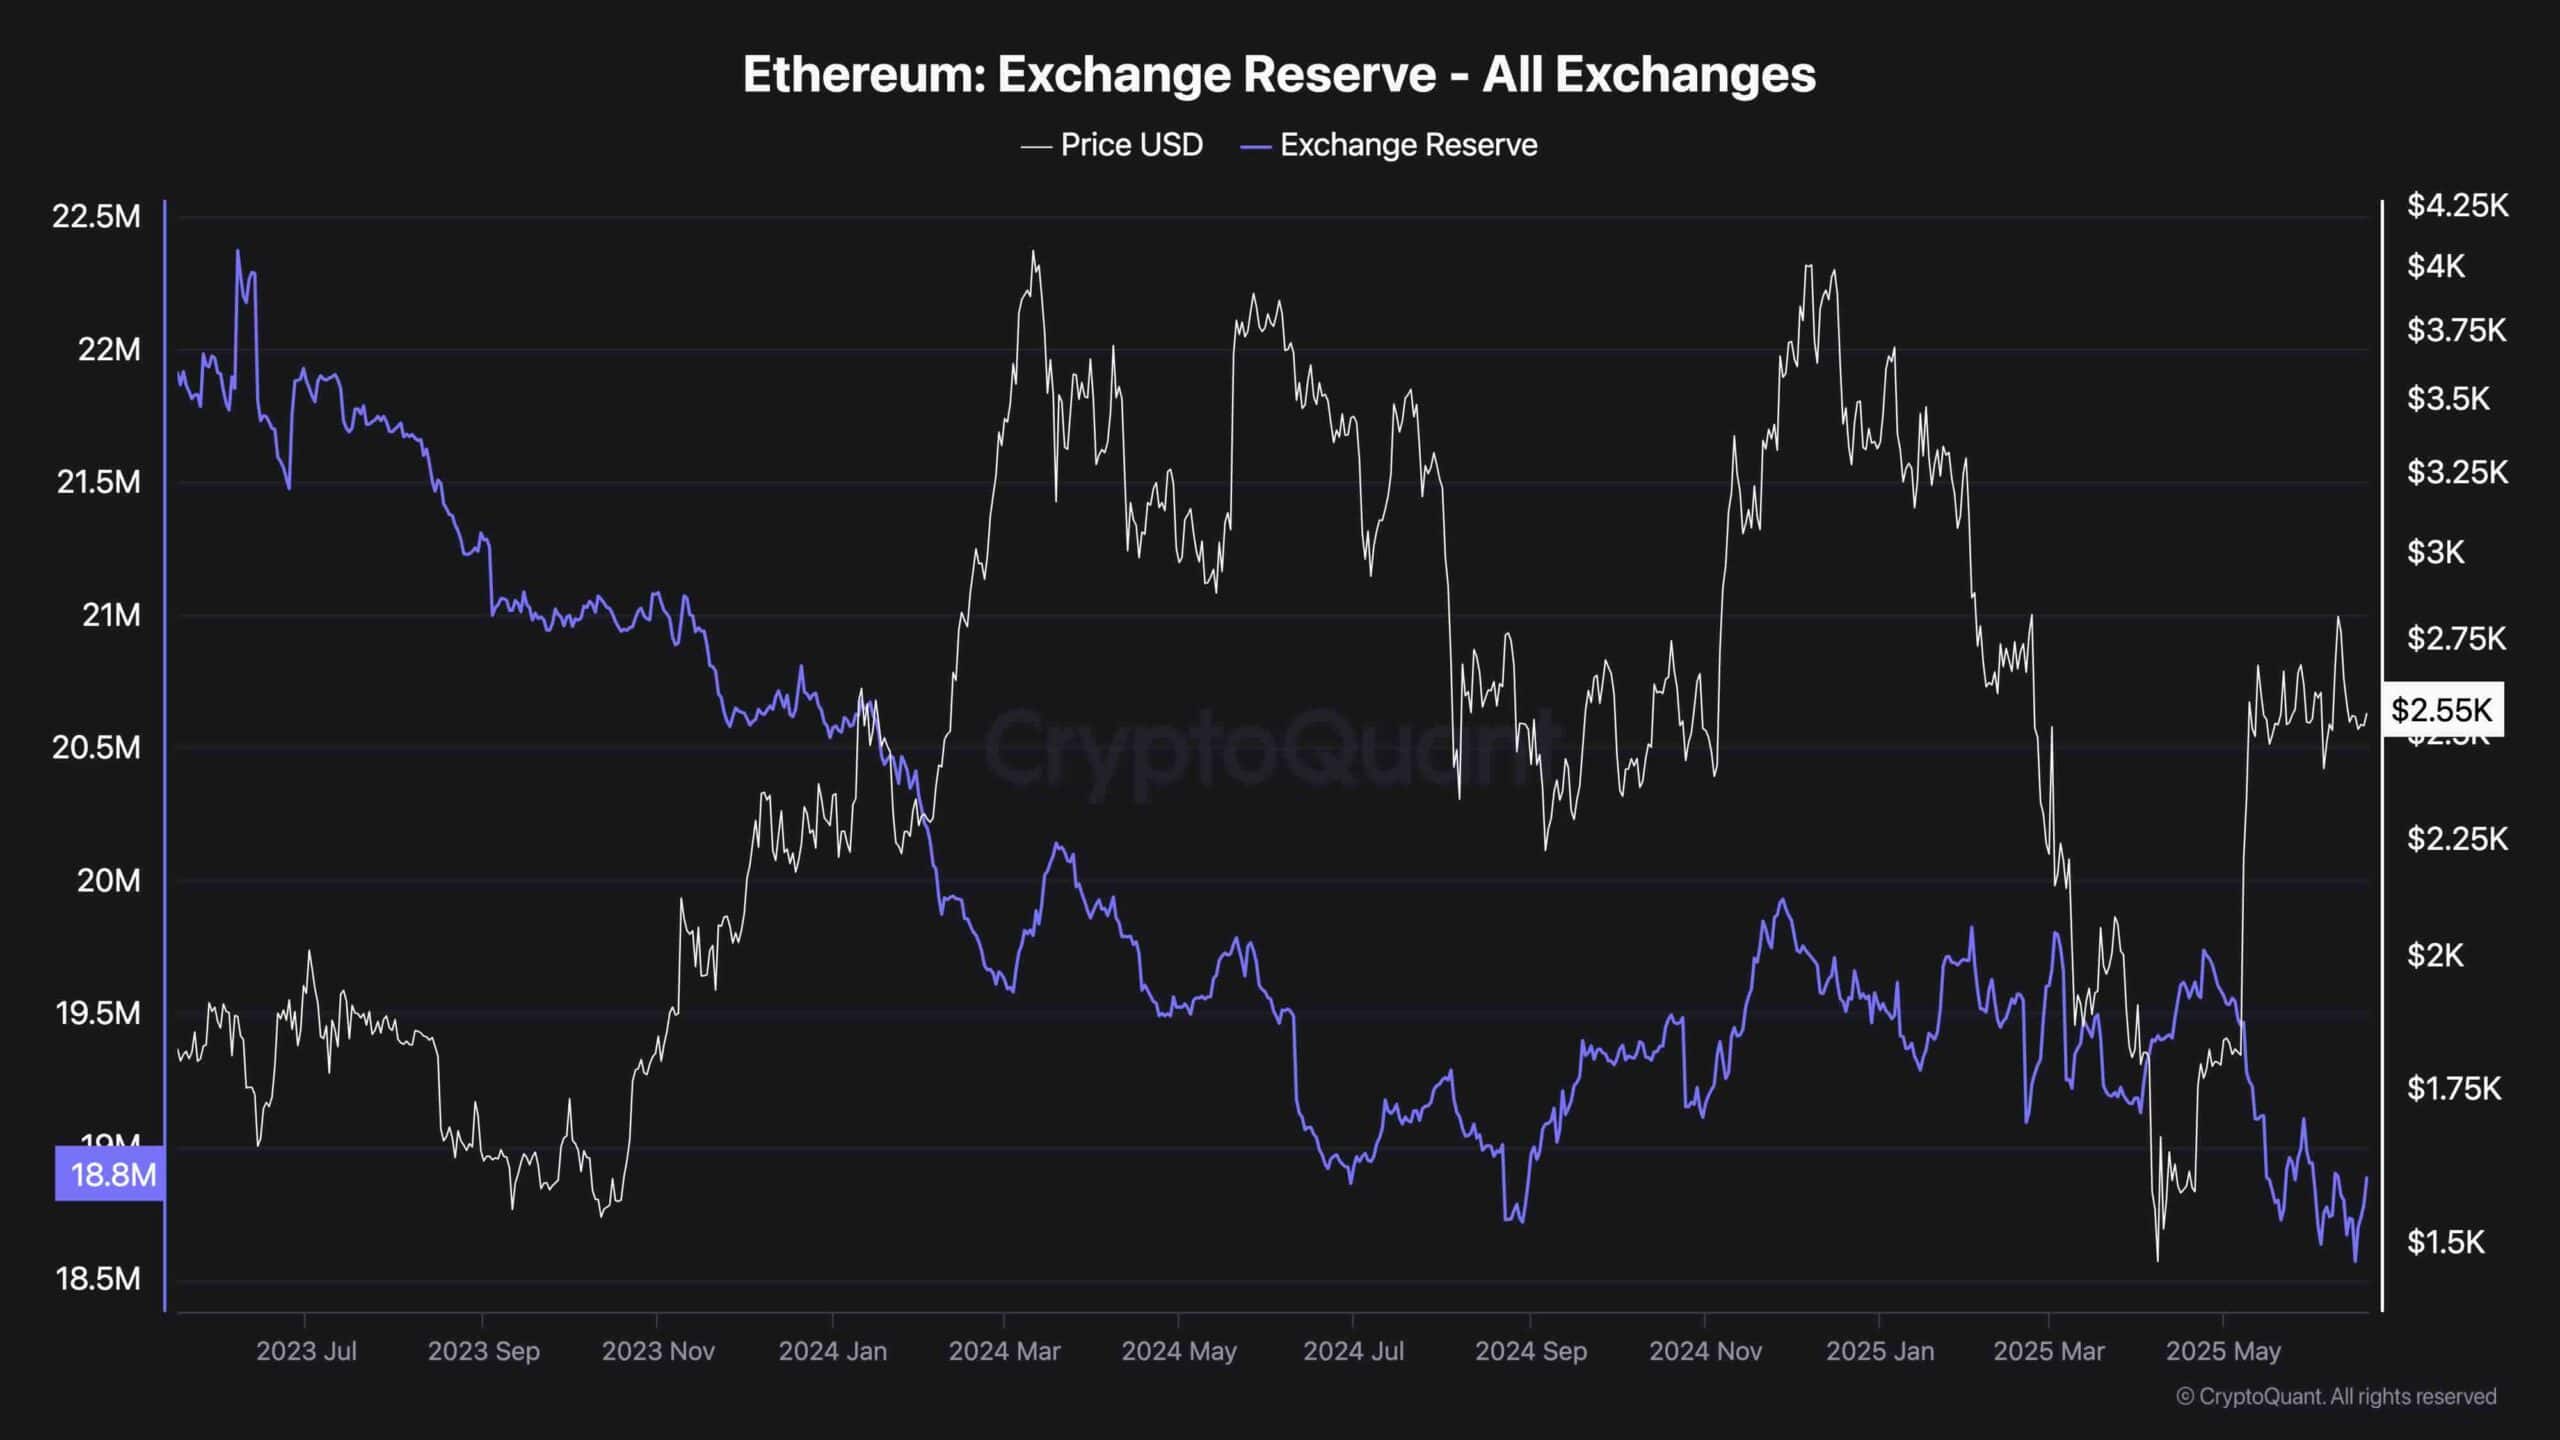
One of the most important long-term signals for Ethereum remains the consistent downtrend in exchange reserves. Currently sitting at 18.8 million ETH, this is one of the lowest levels in recent history. Exchange reserve data indicates how much ETH is held on centralized trading platforms, meaning a downtrend signals that coins are being withdrawn into self-custody, staking, or cold wallets.
Historically, sustained drops in exchange reserves suggest a supply squeeze narrative building beneath the surface. Fewer tokens on exchanges reduce the available selling pressure and can lead to explosive upside when demand rises.
Even as ETH struggles to break out technically, this silent accumulation phase shows confidence among long-term holders. If this trend continues, it may act as a powerful tailwind once technical resistance levels are finally breached.
Read the full article here


