


Bitcoin entered the weekend under selling pressure, testing major technical levels amid declining momentum and thin weekend liquidity.
Analyst Altcoin Sherpa highlighted the $100,000 level as a critical support zone. He warned that a breakdown below this area could trigger a sharp decline.
Bitcoin Poised at $100K Support. Source: Altcoin Sherpa on X
The chart shows Bitcoin forming a potential distribution pattern near the top, with repeated retests of the $100,000 support. Altcoin Sherpa stated that if this level breaks, the next key area to watch is $96,000. He noted that this level aligns with the point of control (PoC) from November 2024 and the 200-day exponential moving average (EMA), adding to its significance as a possible bounce zone.
Volume data also shows dense activity between $95,000 and $100,000, indicating strong previous interest. A break below $100,000 could trigger a sharp move toward this liquidity pocket.
Altcoin Sherpa concluded that for now, $100,000 remains pivotal. He advised watching Bitcoin’s first reaction at this level before expecting further downside.
Bitcoin Slides Into Critical $102K–$100K Zone, Skew Flags Weekend Breakdown Risk
Skew also warned that the $102,000 to $100,000 range marks a highly important support area. The analyst posted a 4-hour chart showing Bitcoin breaking below the daily open, monthly open, and hovering just above a key low-volume area.
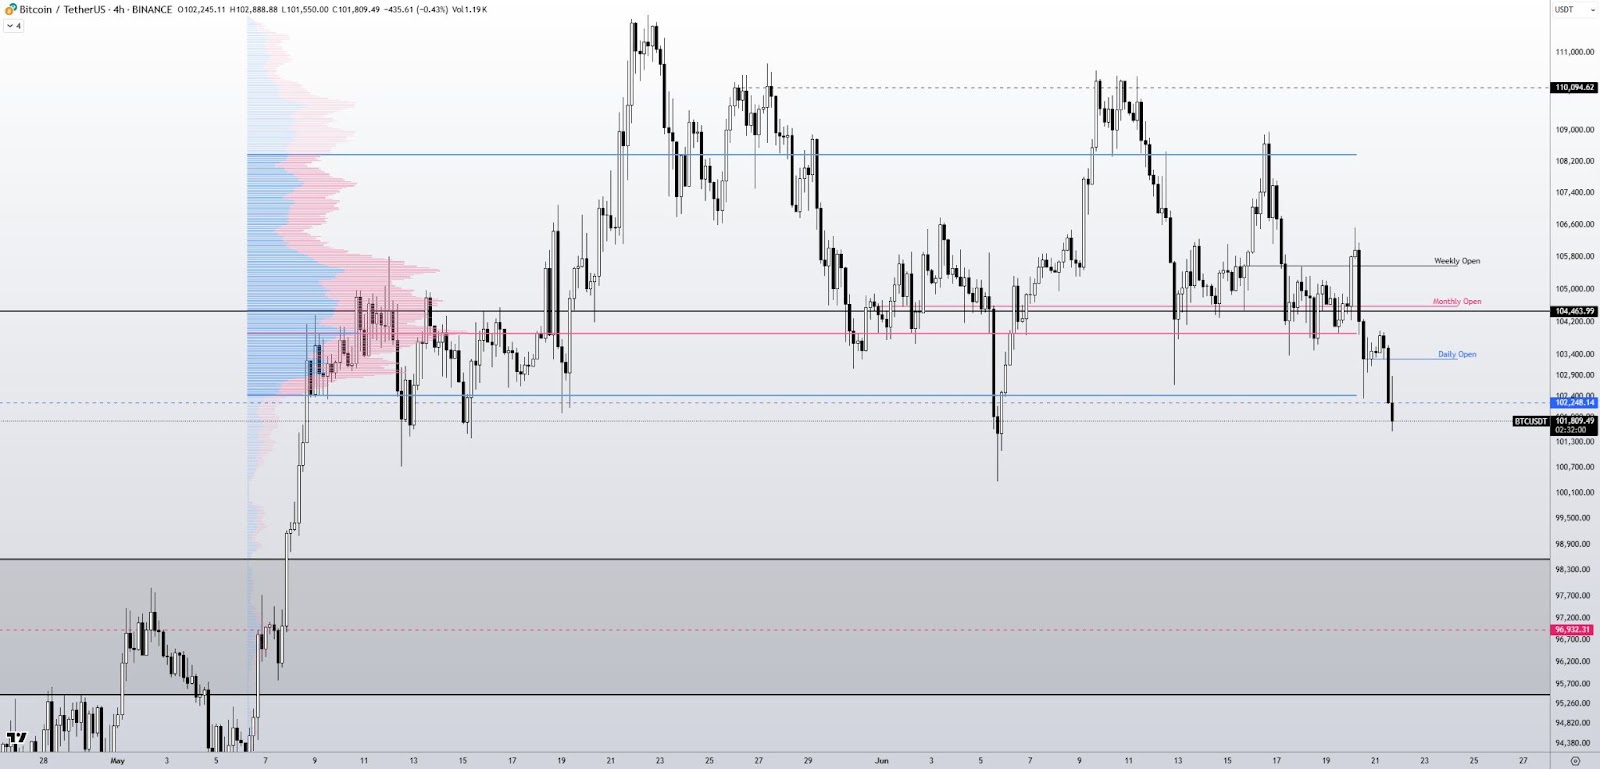
Bitcoin Drops Into Key Demand Zone. Source: Skew on X
The chart shows a clean rejection near $104,463 — the monthly open — followed by consecutive lower highs and a failed retest of prior support. Price dipped below the daily open at $102,248 and now sits on thin liquidity, with limited volume support until around $97,000.
Volume profile analysis highlights that Bitcoin previously consolidated around $102K to $104K, forming the last high-volume node. Below this zone, the price may fall faster due to weaker support and limited bids, especially on a weekend when order books are thinner.
Skew emphasized the importance of the $102K–$100K range. He noted that while the move happened over the weekend, the reaction in this zone will be crucial for short-term price direction.
Bitcoin RSI Drops to 39.5, Signals Weak Momentum Ahead
Meanwhile, Bitcoin’s daily Relative Strength Index (RSI) fell to 39.51, showing weakening bullish momentum. The RSI has consistently trended downward since mid-May and now sits below its signal line, which stands at 51.60.
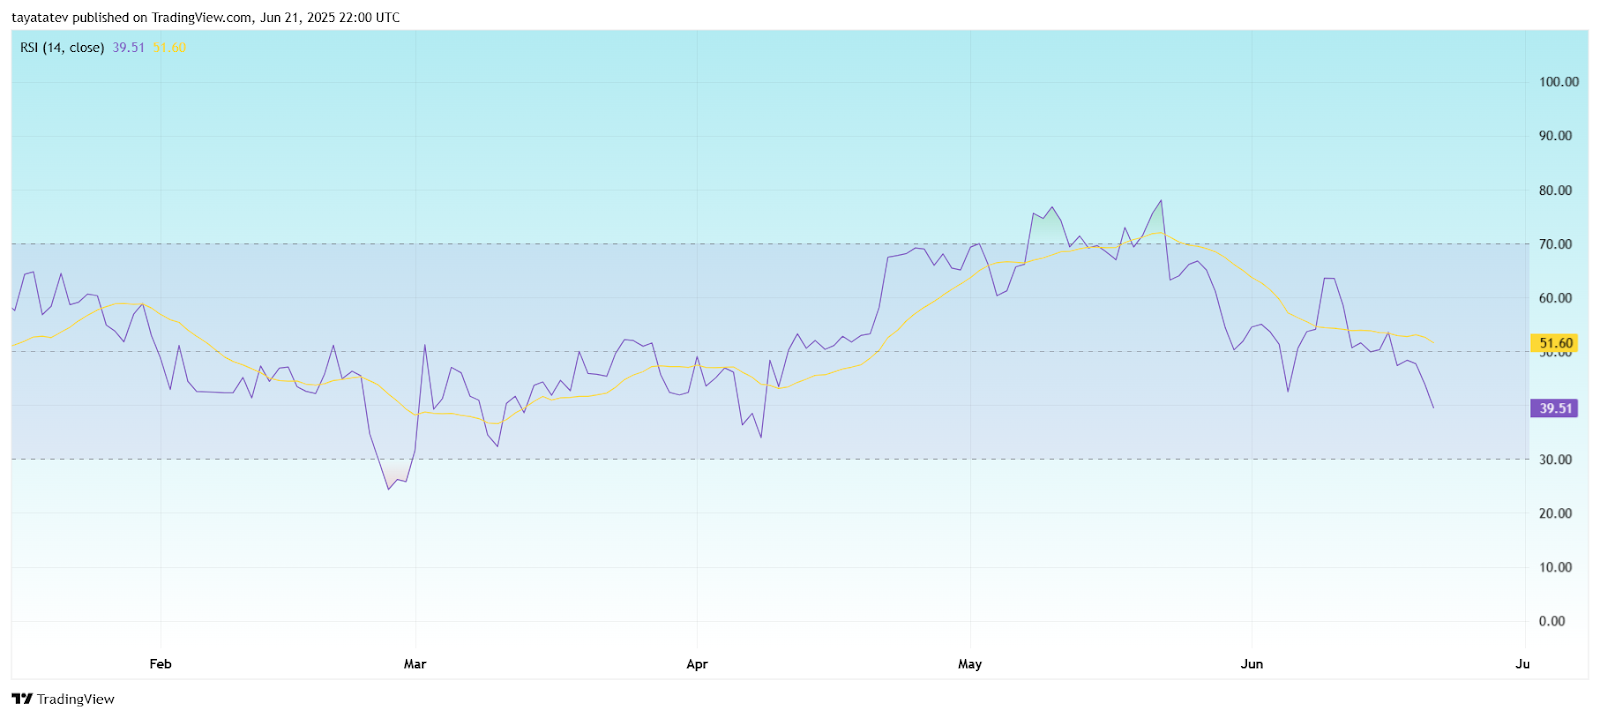
Bitcoin RSI Shows Bearish Divergence. Source: TradingView
The indicator stayed mostly above 50 during April and early May, suggesting earlier strength. However, the recent crossover and decline below the 40 level indicate that sellers are gaining control. If the RSI continues falling, it may enter oversold territory below 30, typically seen during extended downtrends.
The sustained divergence from the signal line also shows limited buying pressure. Traders often view this setup as a sign of increasing bearish momentum, especially when the price breaks below support levels alongside falling RSI.
Disclaimer: The information presented in this article is for informational and educational purposes only. The article does not constitute financial advice or advice of any kind. Coin Edition is not responsible for any losses incurred as a result of the utilization of content, products, or services mentioned. Readers are advised to exercise caution before taking any action related to the company.
Read the full article here


