Ripple’s price has been consolidating on both the USDT and BTC pairs, failing to move decisively in any direction.
This has led to many market participants getting frustrated as XRP fails to follow other large-cap cryptocurrencies.
By TradingRage
The USDT Paired Chart
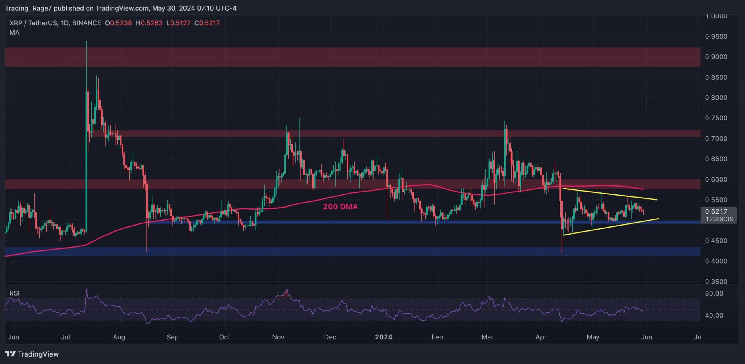
On the USDT paired chart’s daily timeframe, XRP’s price has been moving rangebound inside a symmetrical triangle pattern. The $0.5 level is currently holding the price, preventing it from dropping lower. Yet, the market has also failed to rally toward the 200-day moving average located around the $0.6 resistance zone.
If the asset finally breaks above the triangle, investors can be optimistic that a rise above the 200-day moving average and toward the $0.7 resistance level would be probable.
The BTC Paired Chart
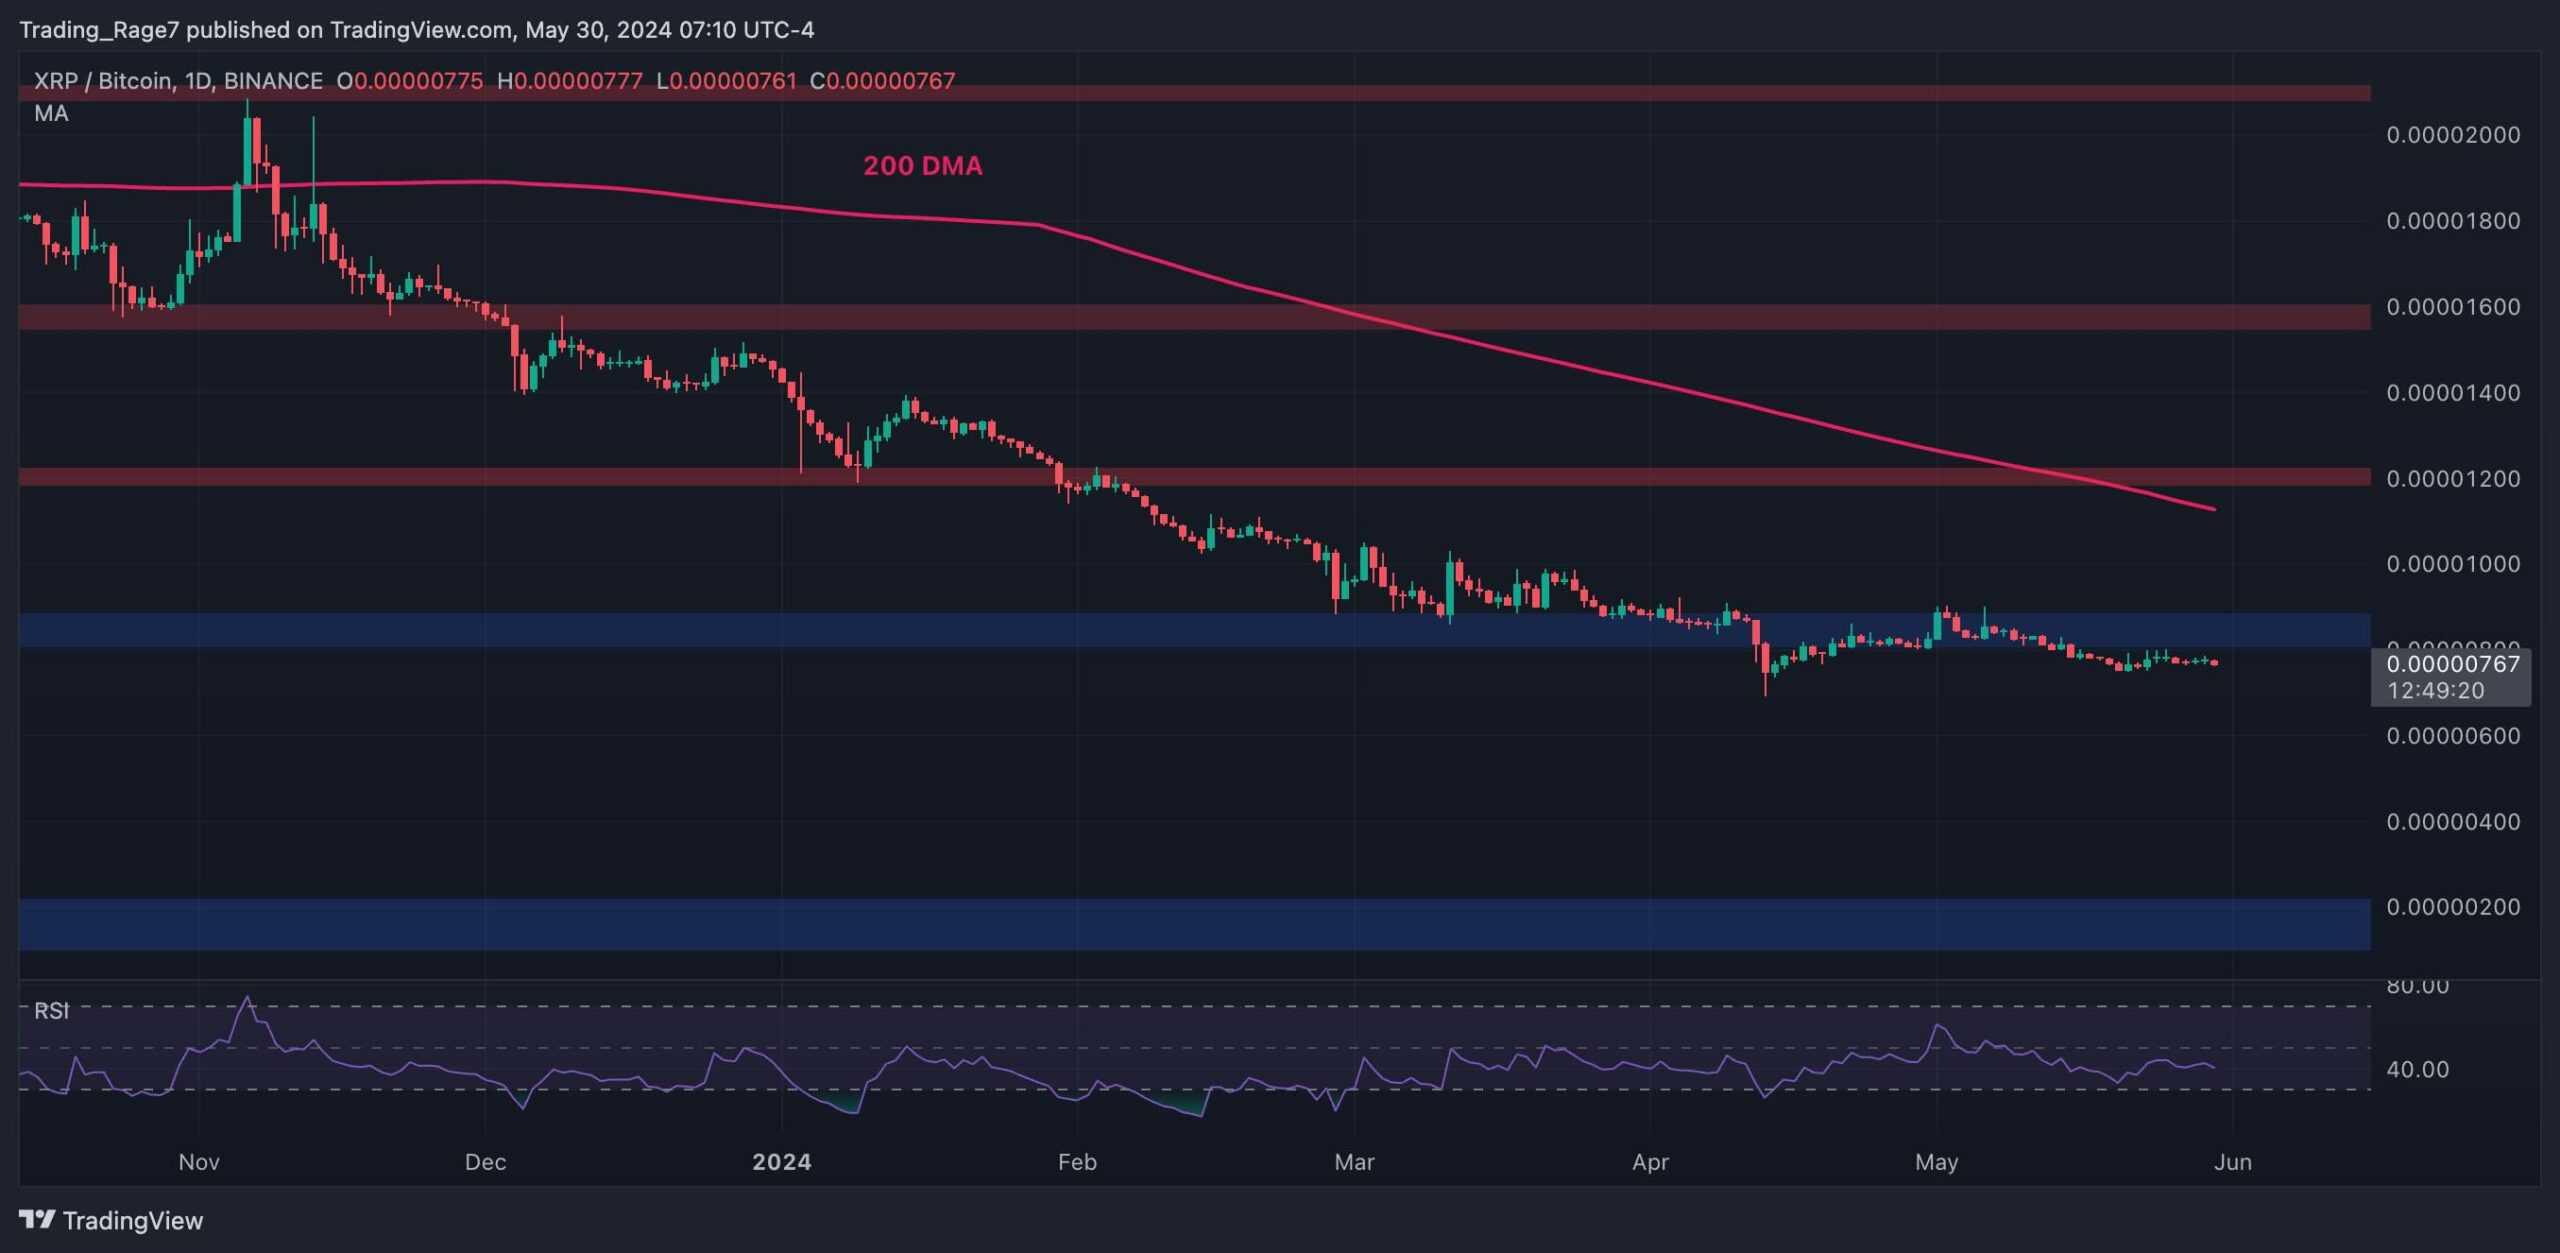
The XRP/BTC pair demonstrates even lower volatility, as the price has been practically moving horizontally. The market has been hovering around the 800 SAT level for almost two months now. Yet, with the long-term trend being bearish and the Relative Strength Index still showing values below 50%, an even deeper decline seems probable at the moment.
Ripple vs. SEC
XRP’s price lastly charted impressive gains when the company behind the token notched a few important victories in its legal spat against the US Securities and Exchange Commission. As such, the recent calmness in that direction could be attributing to the lack of massive movements for XRP.
It’s worth exploring what has been happening on that front, and the latest update, as reported earlier today, suggests that Ripple had further supported its motion to seal data related to the regulator’s request for judgment and remedies.
The regulator believes this information is crucial to the case, while the company asserted that it has no relation to it.
Read the full article here


