


Ethereum price today: $2,600
- Ethereum price broadly consolidates after breaking above its 50-day EMA at $2,535, suggesting a possible rally ahead.
- US spot Ethereum ETFs records an inflow of $17 million on Monday.
- Ethereum’s open interest surged more than 16%, indicating new buying activity.
Ethereum (ETH) stabilizes around $2,600 on Tuesday after a 6.5% rally on Monday that led prices to break through key resistance levels. Some signs of a mild recovery emerged via inflows into Spot Exchange Traded Funds (ETFs) and a surge in open interest, indicating new buying activity and hinting at a continuation of the rally.
Ethereum posts highest daily gain in two months
US Ethereum spot ETF posted a mild inflow of $17 million on Monday, according to data from CoinGlass. Studying the ETF flow data can be useful for observing institutional investors’ sentiment toward Ethereum. If the magnitude of inflow increases and continues, demand for Ethereum will increase, leading to a rise in its price.
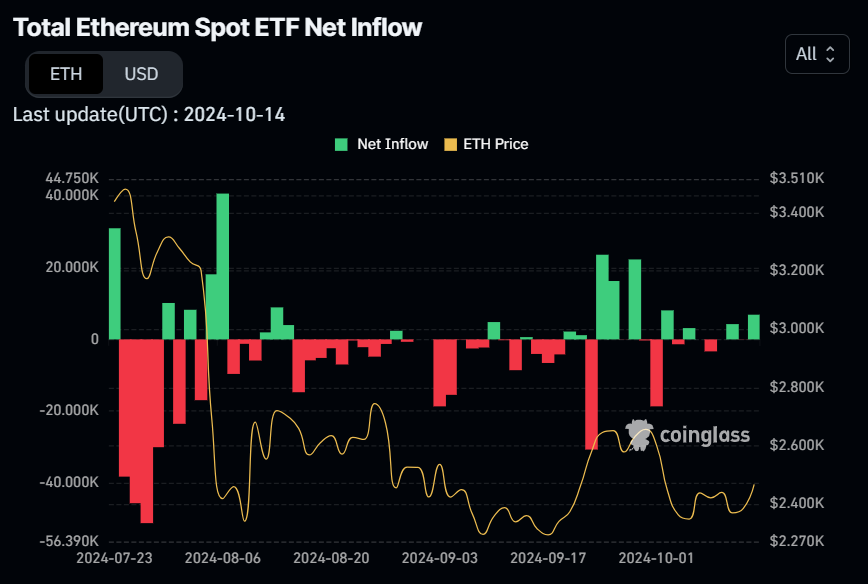
Total Ethereum Spot ETF Net Inflow chart. Source: Coinglass
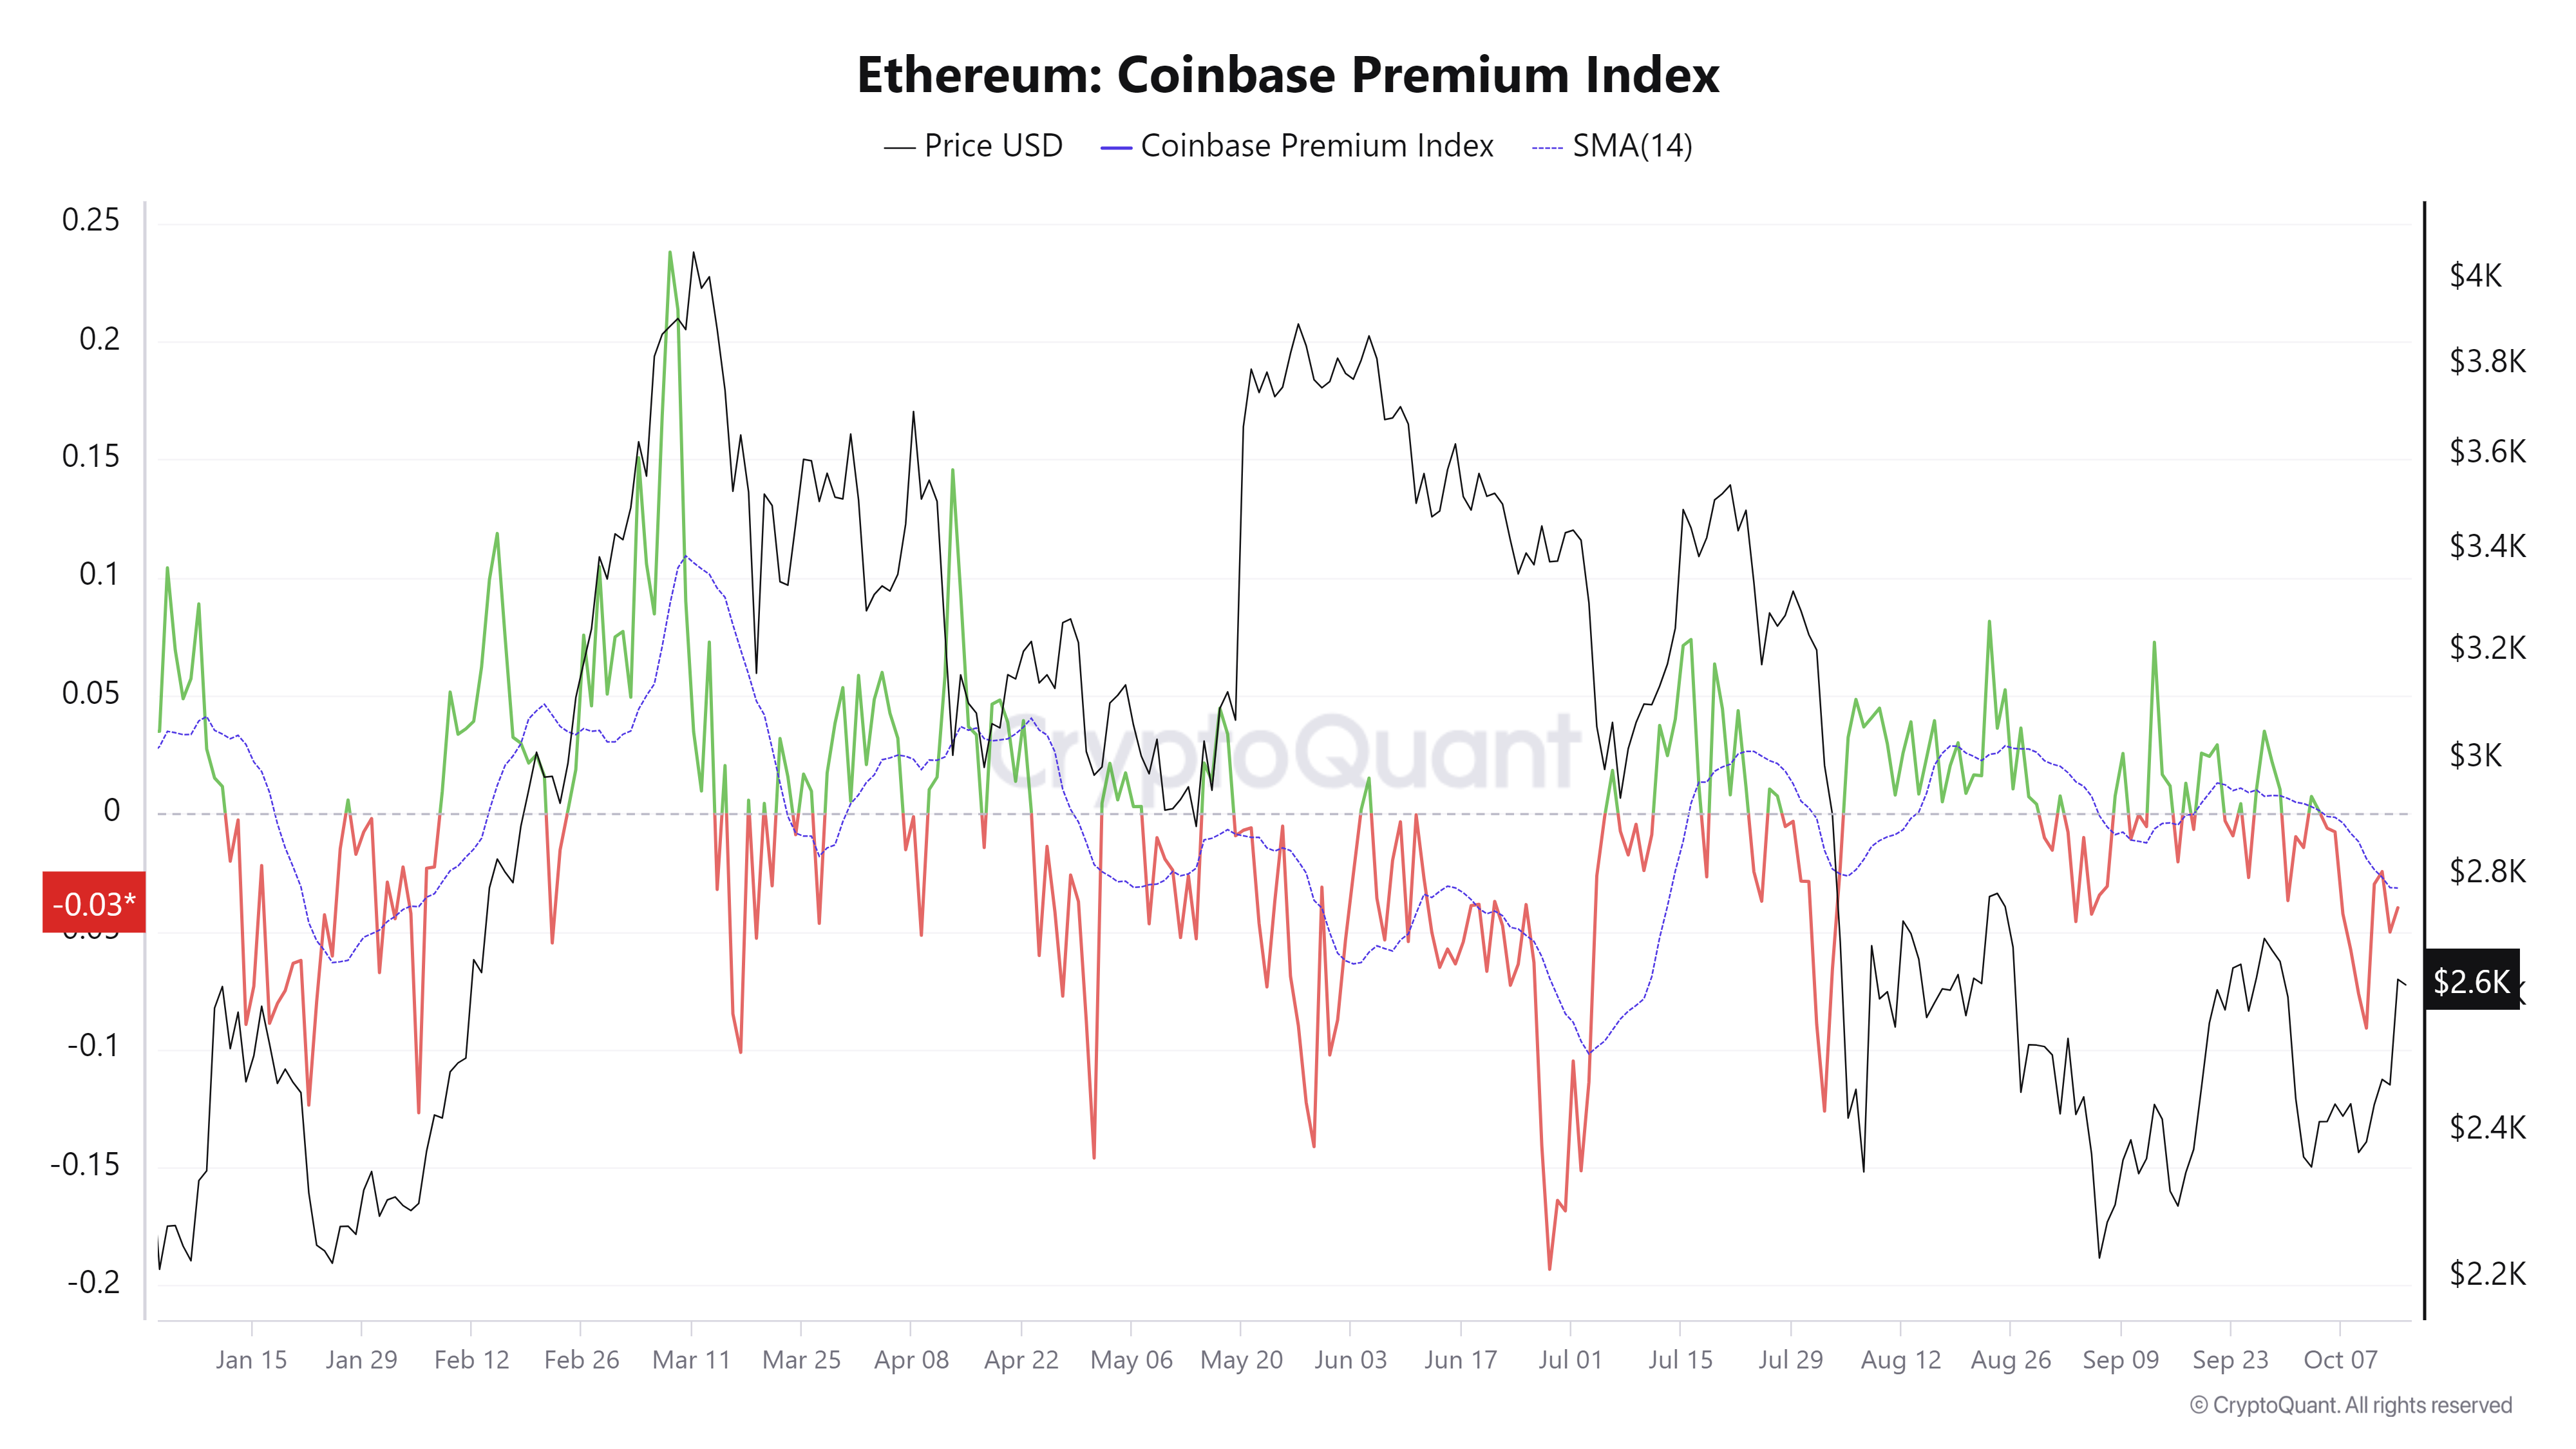
CryptoQuant’s Ethereum Coinbase Premium Index shows some signs of recovery, although it still remains below its neutral levels.
The Coinbase Premium indicator, which measures the price gap between Coinbase Pro (USD pair) and Binance (USDT pair), serves as a key metric for assessing the behavior of large-wallet investors as it reflects whale accumulation trends. This is significant given that Coinbase Pro is regarded as a primary gateway for institutional cryptocurrency purchases.
In the case of Ethereum, the index rose from -0.090 to -0.039 from Thursday to Monday, indicating some increase in demand but still trading below its 14-day Simple Moving Average (SMA) at -0.031. This small rise indicates that some whales show mild signs of accumulation. For Ethereum’s price to continue its recovery rally, the metric should rise above its neutral value of zero.

Ethereum Coinbase Premium Index chart. Source: CryptoQuant
Moreover, Lookonchain data shows that Galaxy Digital – an asset management company offering an Over-the-Counter (OTC) platform for institutional investors – deposited 13,580 ETH worth $34.3 million on Monday to different centralized exchanges. This deposit of ETH tokens to exchanges could be interpreted as a sign of selling activity. If this magnitude of deposits continues, it will generate more selling pressure.
A #GalaxyDigital OTC wallet deposited 13,580 $ETH($34.3M) to #Coinbase, #OKX and #Binance in the past 14 hours.https://t.co/zlZMEpxj7r pic.twitter.com/cqfAUw9RRy
— Lookonchain (@lookonchain) October 14, 2024
Ethereum’s price rose 6.5% on Monday but Ethereum’s Open Interest (OI) has surged even more significantly, jumping by 15.47% from $8.4 billion to $9.7 billion. This is the fastest daily increase in five months.
Increasing OI means that new or additional money is entering the market and new buying, which adds fuel to a bullish trend. On the contrary, when OI decreases, it is usually a sign that the market is liquidating, more investors are leaving, and prices may decrease.
Ethereum’s Open Interest (OI) chart. Source: CryptoQuant
Ethereum Price Forecast: rally likely if 50-day EMA holds as support
Ethereum price broke above the daily resistance level at $2,461 and rallied 6.5%, closing well above its 50-day Exponential Moving Average (EMA) at $2,535 on Monday. At the time of writing on Tuesday, it trades slightly down at around $2,600.
If the 50-day EMA at $2,535 holds as support, ETH could extend the rally to retest its August 24 high of $2,820.
The MACD indicator supports Ethereum’s rise, signaling a bullish crossover on the daily chart. The MACD line moved above the signal line on Monday, giving a buy signal. It shows rising green histogram bars above the neutral line zero, also suggesting that Ethereum’s price could experience upward momentum.
Additionally, the RSI on the daily chart trades at 59, above its neutral level of 50, suggesting bullish momentum is gaining traction.
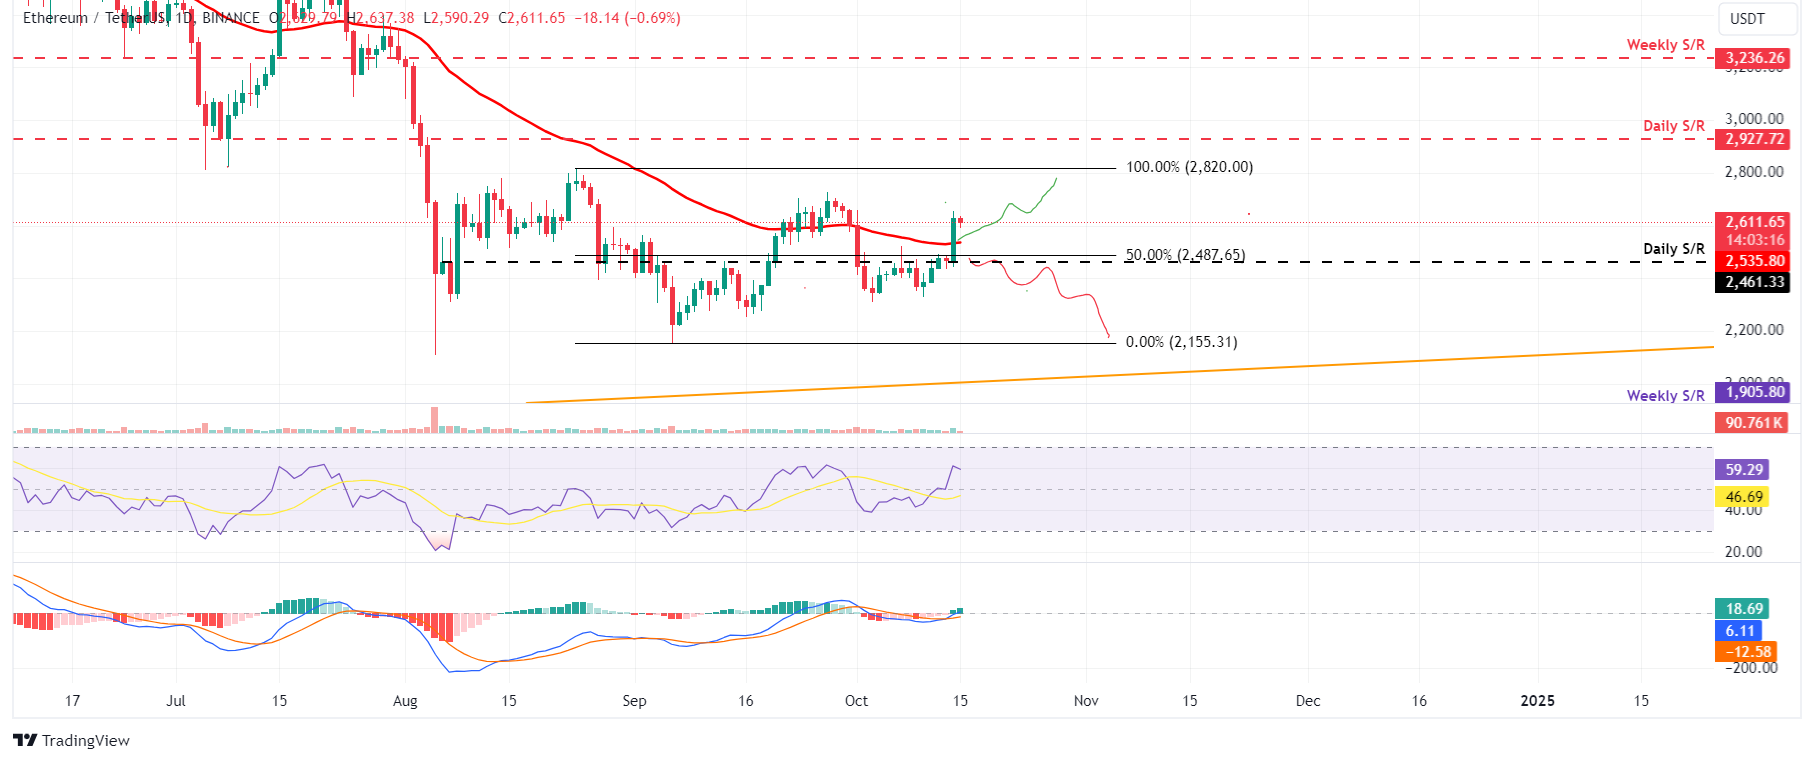
ETH/USDT daily chart
Looking down, if Ethereum’s price closes below the daily support level at $2,461, it could extend the decline by 13% to retest its September 6 low of $2,150.
Read the full article here


