


On February 3rd, Monday, the crypto market witnessed heightened volatility as Bitcoin price plunged to a low of $92,100, before reverting to $101,000. The sharp downfall triggered a massive liquidation of $1.98 Billion among the $590k trade, according to CoinGlass. With the mounting selling pressure, the dogwifnat price breaks below an 11-month accumulation, signaling the risk for further correction ahead.
Key Highlights:
- The dogwifhat price breakdown from $1 support would accelerate market selling pressure.
- The dynamic resistance 20-and-50-day exponential moving average could drive the prolonger correction in dogwifhat price.
- The $1 level stands as key resistance against buyers in their attempt to drive a bullish recovery.
dogwifhat Price Hints at Extended Correction below $1
In a 5-day downfall, the dogwifhat price plunged from $1.26 to $0.85, registering a loss of 30%. This downfall gave a decisive breakdown below a long-coming support of $1.
Since mid-April 2024, the WIF has been resonating between $4.8 to $1 horizontal levels. The coin price bounced twice from each level, indicating the reliability of these patterns to lead to future prices.
WIF/USDT -1d Chart
On February 1st, the sellers could break down the bottom support and strengthen their grip over this asset as they can at a crucial psychological level. With Bitcoin price experiencing renewed buying pressure at $91,200, the WIF price could rebound to the $1 level as a retest as potential resistance.
Crypto analyst Ali Martinez shares the range of this potential retest phase with a bear flag pattern. Theoretically, this chart setup shows a downsloping trendline showcasing the dominating trend and a temporary pullback to recuperate the selling pressure.
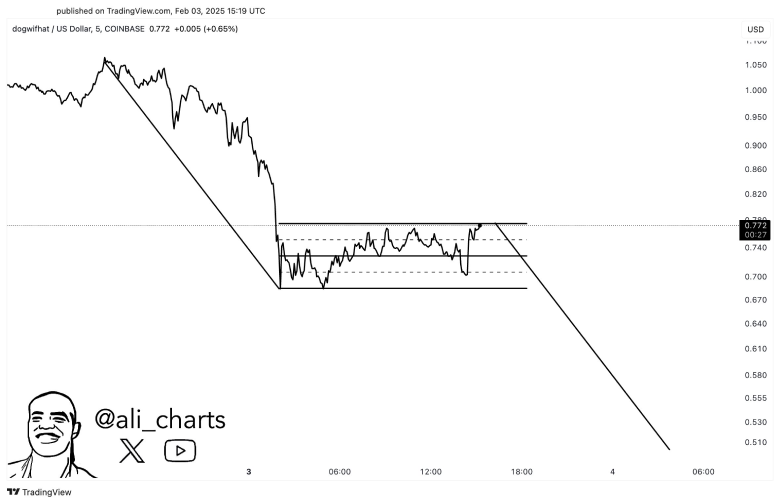

If the pattern holds, the post-breakdown fall could plunge the asset to the $0.51 floor.
Technical Indicator:
Exponential Moving Average: A bearish alignment between key daily EMAs (20. 50. 100, and 200) accentuated the negative sentiment in the market. Moreover, the 20-day EMA slope acts as key dynamic resistance for short-term trends.)
Relative Strength Index: The daily RSI slope plunged to the oversold region (<30), indicating the dogwifhat price is heavy discount, which could attract potential buyers.
Read the full article here

 Price Drops 13% and Loses $10 Billion Market Cap")

