Cardano (ADA) shows bearish momentum with critical support and resistance levels dictating potential price movements.
On-chain data reveals declining user engagement and short-term trading activity, impacting Cardano’s market outlook.
Cardano Technical Analysis on the 4-Hour Timeframe
The ADA/USDT chart shows a bearish trend in the 4-hour timeframe. The price is below both the 100 EMA ($0.464) and the 200 EMA ($0.472). This indicates short and medium-term bearish momentum. The price is also struggling below the 0.618 Fibonacci level at $0.458, which is a crucial support.
The Relative Strength Index (RSI) is 42.57, below the neutral 50 level, suggesting strong selling pressure. The downward trend in RSI confirms the bearish sentiment. If the RSI continues to drop, it may signal further downside potential.
Key support is at $0.458, with a breakdown potentially leading to $0.420. Resistance levels to watch are $0.525 and $0.592. A move above these levels would indicate a bullish reversal. Currently, the sentiment remains bearish unless these resistance levels are broken.
Read More: How To Buy Cardano (ADA) and Everything You Need To Know
Cardano Price Analysis. Source: TradingView
Analyzing Cardano’s Blockchain Activity
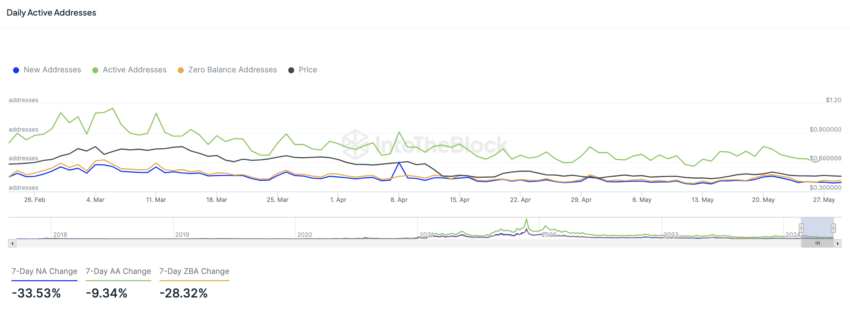
Daily Active Addresses Analysis
Notably, the green line representing active addresses shows a downward trend, indicating a decline in user engagement and transactions over time. This decline is a bearish signal, reflecting waning interest or activity in the Cardano network, which can impact its overall valuation and market sentiment.

Daily Active Addresses: IntoTheBlock
A key observation is the blue line (new addresses) superposition and the orange line (zero balance addresses). This alignment suggests that new entrants into the ADA ecosystem are not retaining their coins. Instead, they are either quickly selling off their ADA or using it in ways that result in zero balances.
This behavior indicates a lack of long-term commitment from new users, which is a bearish fundamental sign for Cardano. Without new investors holding onto their ADA, sustained growth and stability in price become challenging.
Furthermore, the percentage changes highlight the bearish trend. Over the past 7 days, new addresses have decreased by 33.53%, active addresses by 9.34%, and zero balance addresses by 28.32%. These metrics reinforce the narrative of declining interest and participation in the ADA network.
With fewer new addresses and a high number of zero balance addresses, the fundamental outlook remains bearish, suggesting potential further downside for ADA unless there is a significant shift in on-chain activity and investor behavior.
Addresses by Time Held Analysis
The chart illustrating addresses by time held provides a comprehensive view of the Cardano holding behavior. The green area represents Cruisers (holding for 1-12 months), and the orange area denotes Traders (holding for less than a month).
Read more: Cardano (ADA) Price Prediction 2024/2025/2030
Addresses by Time Held Analysis. Source: IntoTheBlock
A significant observation is the decline in the proportion of traders, which has reduced by 20.86% over the past 30 days. This suggests a reduced short-term speculation and trading activity, which is typically bearish.
Traders’ diminishing presence indicates that fewer investors are actively trading ADA in the short term, possibly due to a lack of confidence in immediate price appreciation or volatile market conditions.
Strategic Recommendations
Monitor Resistance Levels: Monitor the resistance levels closely, especially the 0.618 Fibonacci level at $0.458. A break above this level could signal market optimism and a potential price reversal, shifting the outlook from bearish to neutral.
Evaluate Engagement Metrics: Observe the trends in active addresses and the balance behavior of new addresses. The superposition of new and zero-balance addresses indicates reduced engagement, which could impact price stability.
Adjust Trading Strategies: Given the reduction in short-term traders and the current bearish to neutral sentiment, consider short-term trading opportunities while being cautious of potential further downside. Be prepared to pivot strategies if a breakout above key resistance levels occurs, signaling a possible bullish reversal.
Read the full article here

