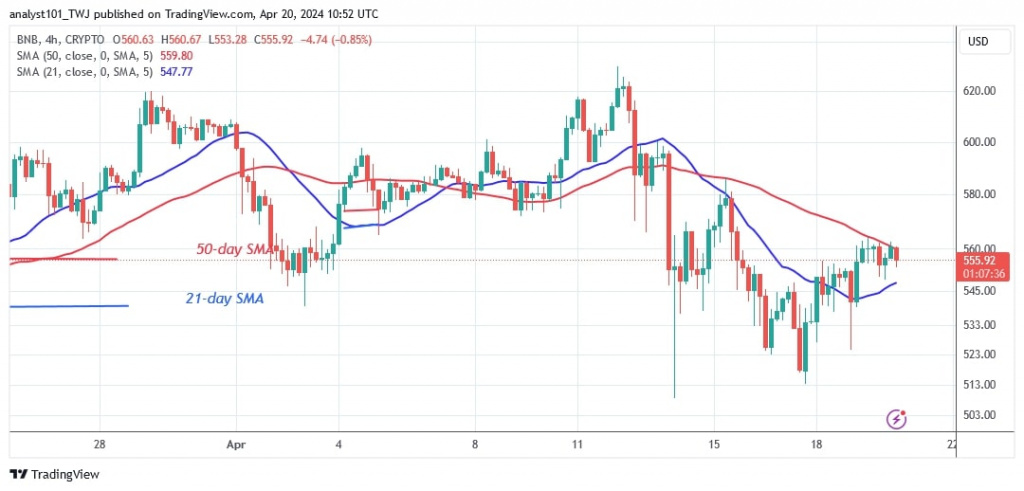
The price of Binance Coin (BNB) is in a sideways trend after the end of the uptrend on March 13, 2024.
Long-term forecast for the BNB price: range
The cryptocurrency fell above the 21-day SMA and started a range-bound move between $520 and $630. The presence of doji candlesticks has slowed down the price movement. Doji candlesticks symbolize traders who are uncertain about the direction of the market. BNB is now worth $554.40. The altcoin is trying to break through the lower price area. Should the bears break the $520 support, BNB would drop to a low of $420.
On a positive note, the presence of doji candlesticks is slowing down the price action. If the resistance level of $645 is broken, the altcoin will resume its uptrend. The market will rise to a high of $920.
BNB indicator reading
BNB price bars are the small doji candlesticks that appear between the moving average lines. Doji candlesticks explain traders’ indifference to market direction. The BNB indicator will continue to fluctuate as the price bars are located between the moving average lines.
Technical indicators:
Key resistance levels – $600, $650, $700
Key support levels – $400, $350, $300
What is the next direction for BNB/USD?
BNB has remained steady as the altcoin trades between $520 and $630. As long as doji candlesticks dominate the price action, the cryptocurrency will continue to trade in a range for a few more days.

Disclaimer. This analysis and forecast are the personal opinions of the author and are not a recommendation to buy or sell cryptocurrency and should not be viewed as an endorsement by CoinIdol.com. Readers should do their research before investing in funds.
Read the full article here

