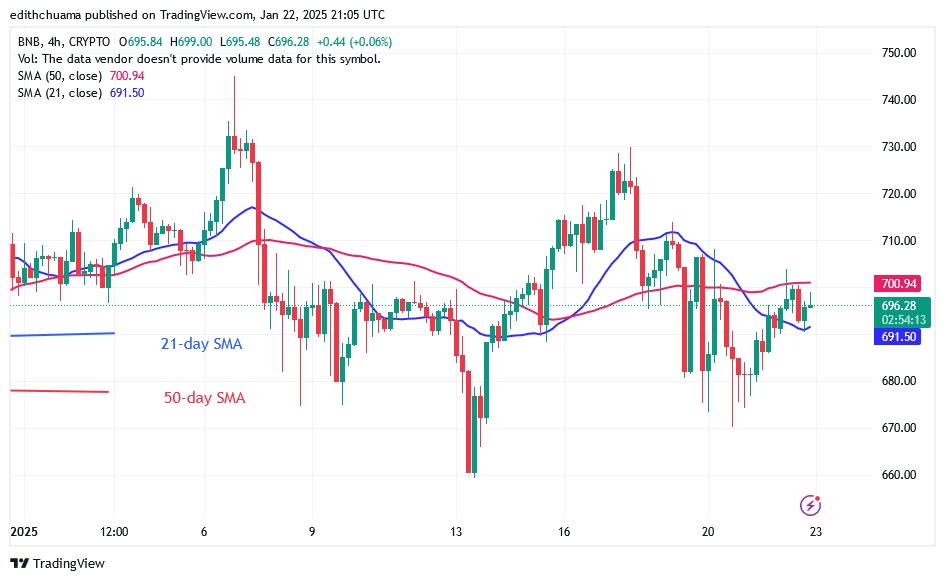
The price of Binance coin (BNB) has fallen below the moving average lines, hitting a low of $664 on January 19, with bulls buying the dips as the altcoin corrected higher. Cryptocurrency price analysis brought by Coinidol.com.
BNB price long-term forecast: bearish
The bullish momentum has stalled at the moving average lines. BNB is trading above the $660 support but below the moving average lines.
Today, the uptrend has stalled at the moving average lines. A break above the moving average lines will signal the resumption of the positive trend. The altcoin will reach its previous high of $730. BNB will fluctuate above the support level of $660 if it fails to break above the moving average lines.
BNB indicator reading
After the negative trend on January 19, the price bars fell below the moving average lines. There were hardly any price changes when the doji candlesticks appeared. The price bars are between the moving average lines, indicating a likely rangebound move for the cryptocurrency. The altcoin will initiate a trend reversal if either the 21-day or 50-day SMAs are breached.
Technical indicators:
Key resistance levels – $600, $650, $700
Key support levels – $400, $350, $300
What is the next direction for BNB/USD?
On the 4-hour chart, BNB is fluctuating because it is trapped between the moving average lines. However, the altcoin is at risk of falling as it is trading in a bearish trend zone. A break below the 50-day SMA would mean that the trend has resumed. In the meantime, the altcoin will continue to fluctuate within its current price range.

Disclaimer. This analysis and forecast are the personal opinions of the author. They are not a recommendation to buy or sell cryptocurrency and should not be viewed as an endorsement by CoinIdol.com. Readers should do their research before investing in funds.
Read the full article here


