Key takeaways:
-
Bitcoin price trades 6% below all-time highs, but several market signals suggest more upside ahead.
-
Bitcoin is poised for a breakout to all-time highs if a key resistance level at $108,000 is broken.
Bitcoin (BTC) price has rebounded 10% since June 5, reaching near-all-time highs at $110,800 on June 9. Meanwhile, analysts say declining open interest and “liquidation exhaustion” suggest that BTC price is primed for the next move.
Is OI divergence bullish for Bitcoin price?
Onchain data reveals a notable divergence between Bitcoin’s price and Binance open interest (OI), showing progressive deleveraging across the derivatives market.
While Bitcoin price came within 1.3% of its all-time high on May 27, Binance OI failed to reach its previous peak in late May, according to data from CryptoQuant. Instead, a distinct divergence has emerged with this metric recording a series of lower lows, as shown in the chart below.
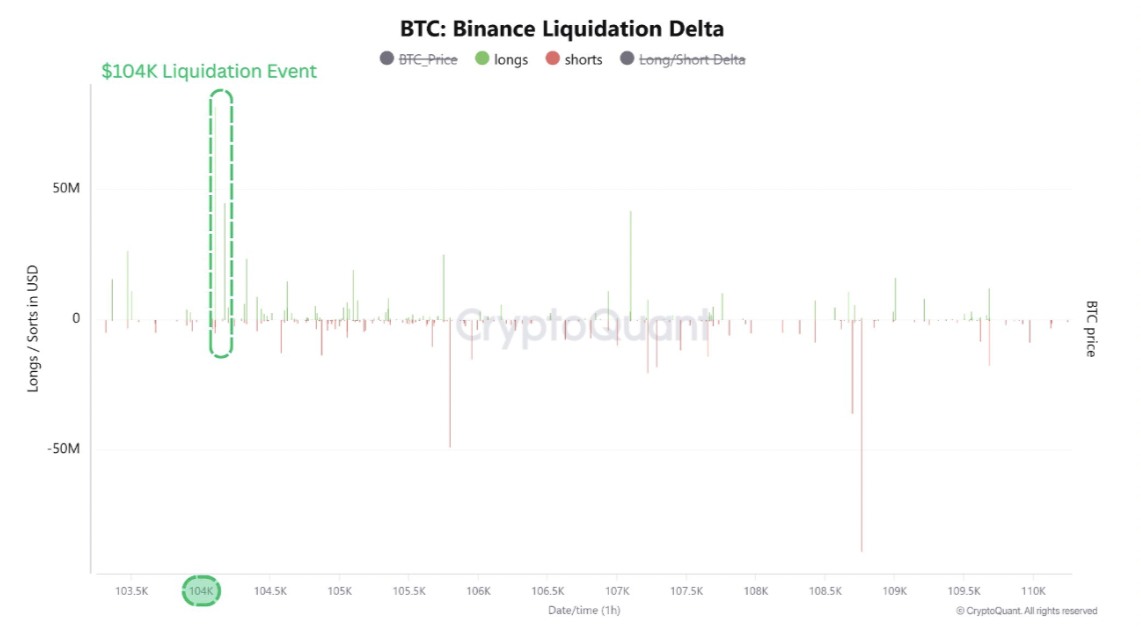
Similarly, the Binance Liquidation Delta chart highlights a sharp liquidation cluster around $104,000, where long positions were forcefully closed when the price dipped below this level on June 13.
Related: Bitcoiners split on $94K or $114K for BTC’s next move as it trades sideways
The market correction, triggered by Israel’s attack on Iran, saw over $453 billion in long Bitcoin liquidated against $59.8 million short positions.

According to CryptoQuant analyst Amr Taha, this reflects “cleansing of latecomers chasing the rally,” which coincides with the Fed’s decision to leave interest rates unchanged.
“This macroeconomic signal often acts as a tailwind for risk-on assets like Bitcoin,” Amr Taha said in a June 19 QuickTake, adding:
‘Historically, BTC has shown bullish tendencies following rate stabilization, especially when paired with signs of liquidation exhaustion and fading open interest.”
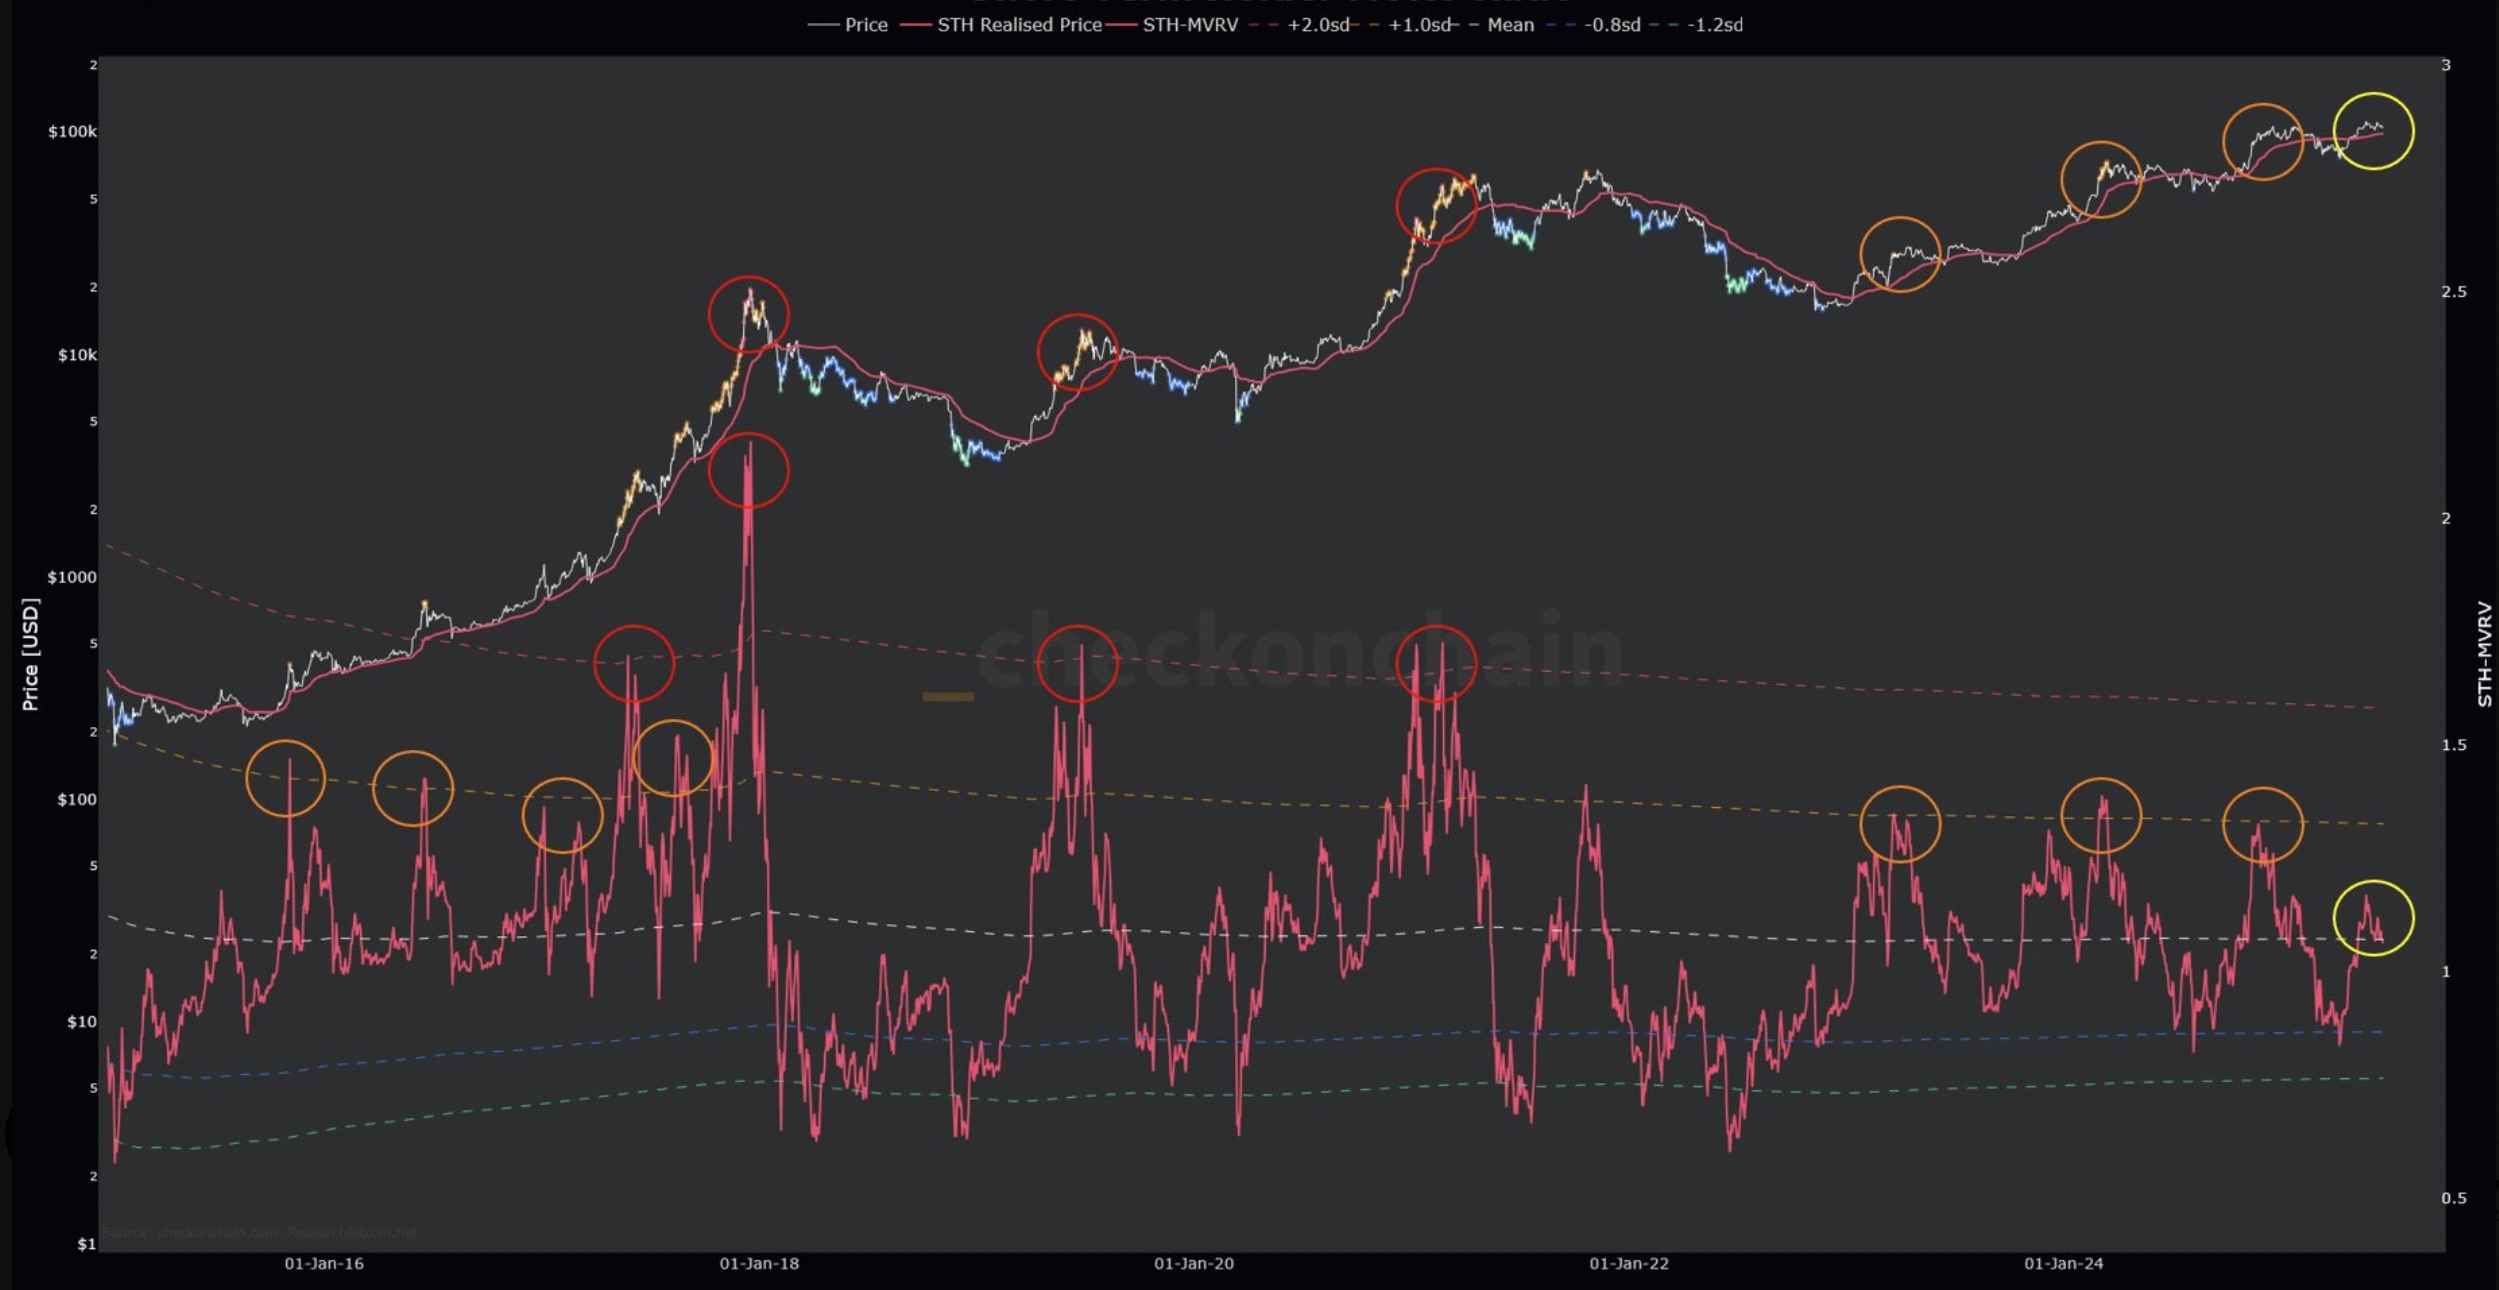
Another significant observation is the position of Bitcoin’s market value realized value (MVRV) around its mean.
“The Bitcoin Short-Term Holder MVRV has returned to the mean despite price nearing all-time highs,” said Bitcoin analyst On-Chain College in a June 20 post on X, adding:
“The market has reset and looks primed for the next move.”

What next Bitcoin price?
Bitcoin price remained range-bound on Thursday below $105,000, per data from Cointelegraph Markets Pro and TradingView.
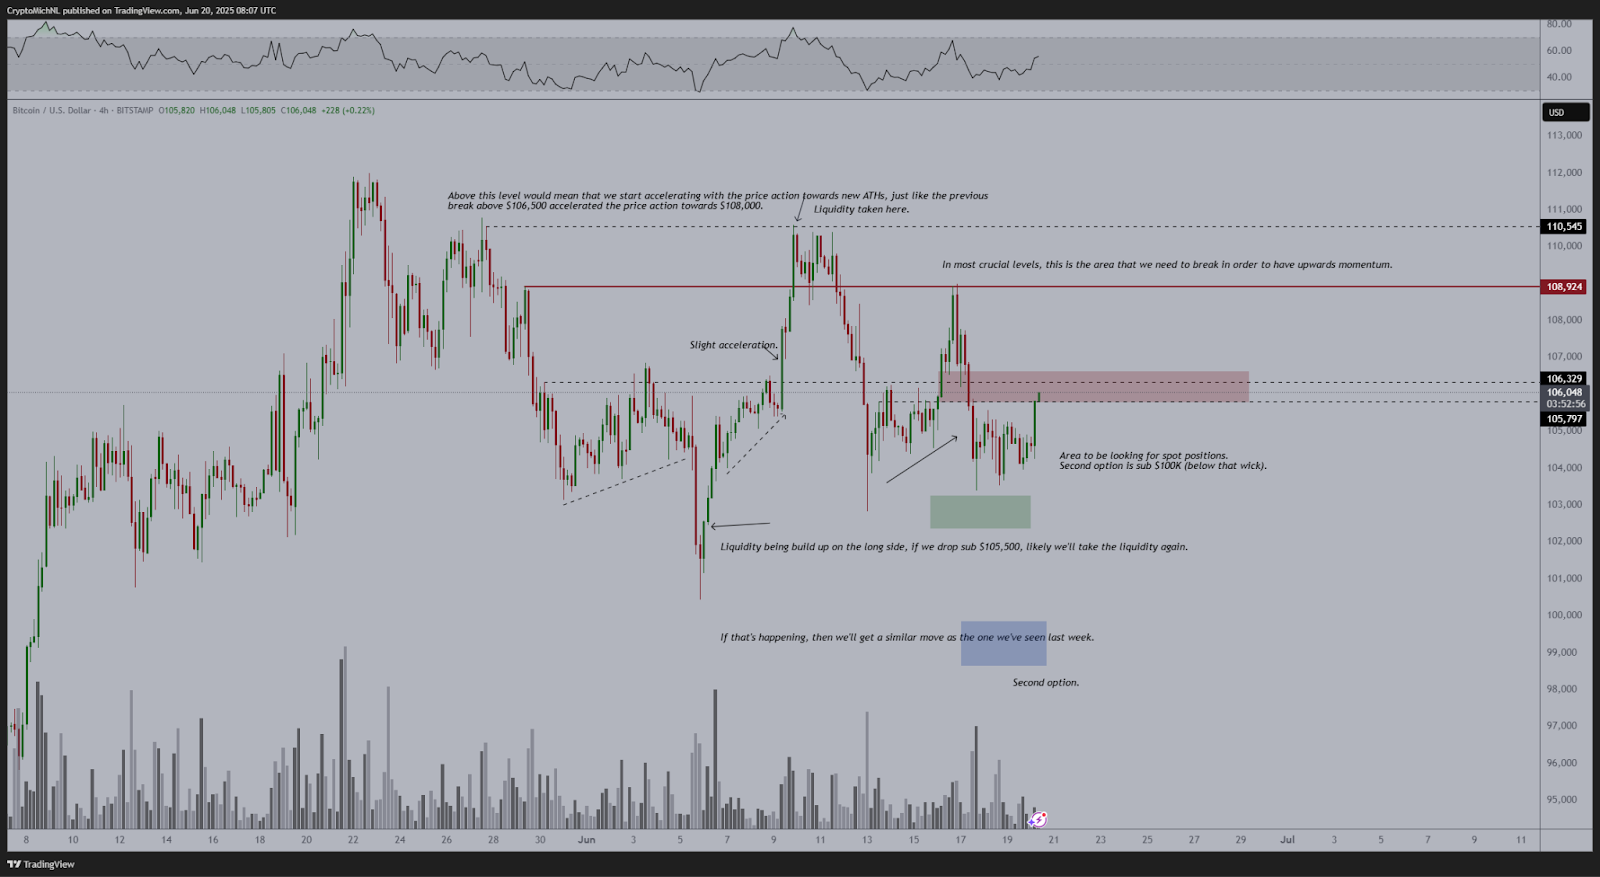
“Bitcoin trending back upward, which is a great sign,” said MN Capital founder Michael van de Poppe in a June 20 post on X.
An accompanying chart showed a key resistance zone at $108,000, which BTC bulls needed to break to trigger an upward movement.
“Facing the crucial resistance zone, through which we’re about to hit a new all-time high once we break through this resistance zone.”

As Cointelegraph reported, BTC price is expected to exit its narrow range between $103,000 and $109,00 this month in a move that would usher it into price discovery.
Although several analysts believe Bitcoin will go above $120,000 this summer, the odds of this happening before July stand at only 16%, according to Polymarket data.
This article does not contain investment advice or recommendations. Every investment and trading move involves risk, and readers should conduct their own research when making a decision.
Read the full article here


