


 Price Prediction for June 21, 2025")
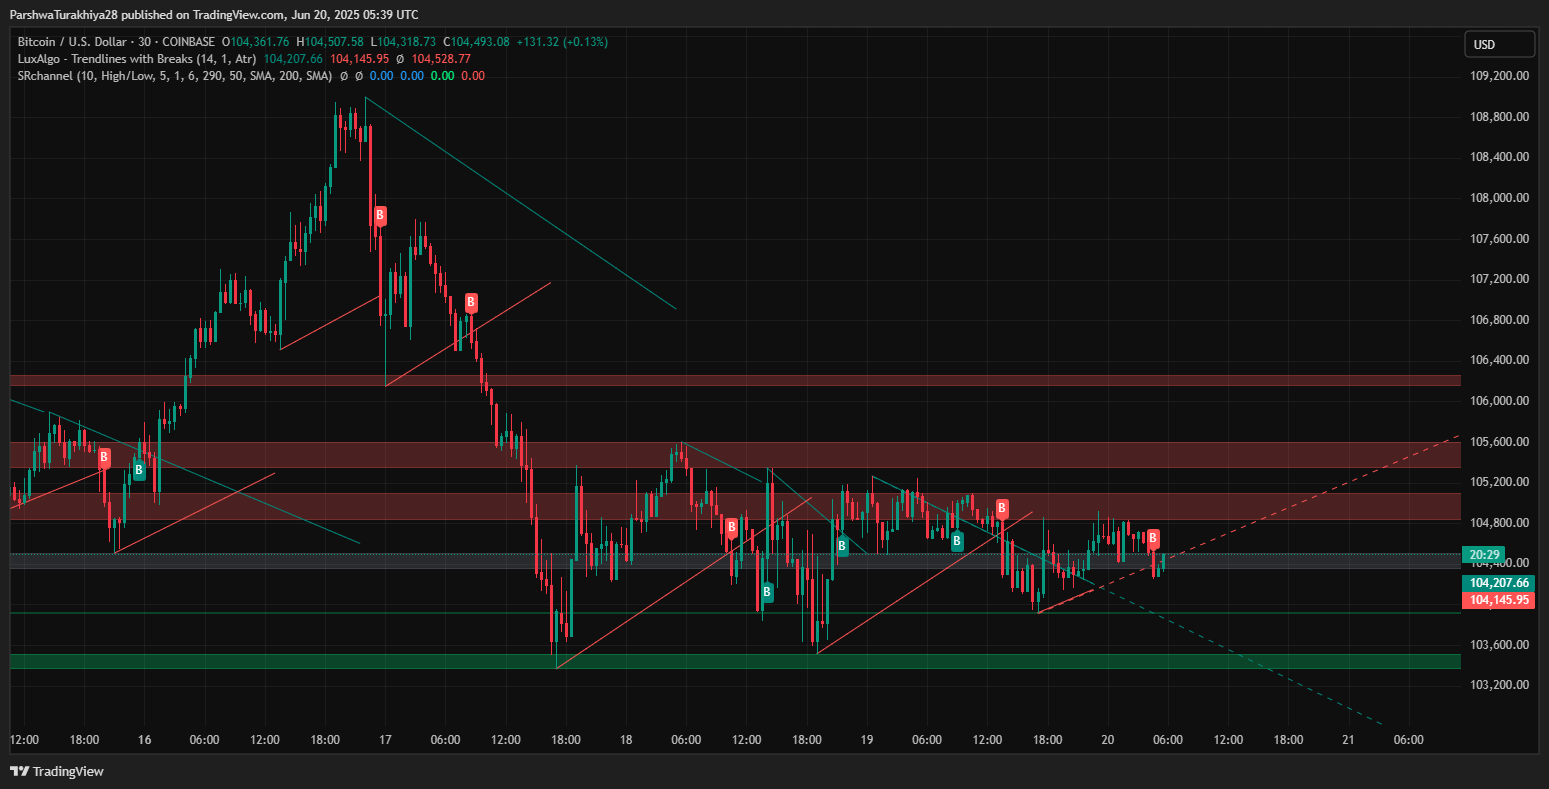
The Bitcoin price today is trading around $104,500, reflecting a narrow range following recent failed breakout attempts above the $108,000 zone. Despite brief spikes above key resistance, Bitcoin price action has remained capped below a declining trendline.
BTC price forecast (Source: TradingView)
The current sideways movement has raised questions about why Bitcoin price going down today even with solid on-chain support and strong liquidity near $104,000.
What’s Happening With Bitcoin’s Price?
BTC price forecast (Source: TradingView)
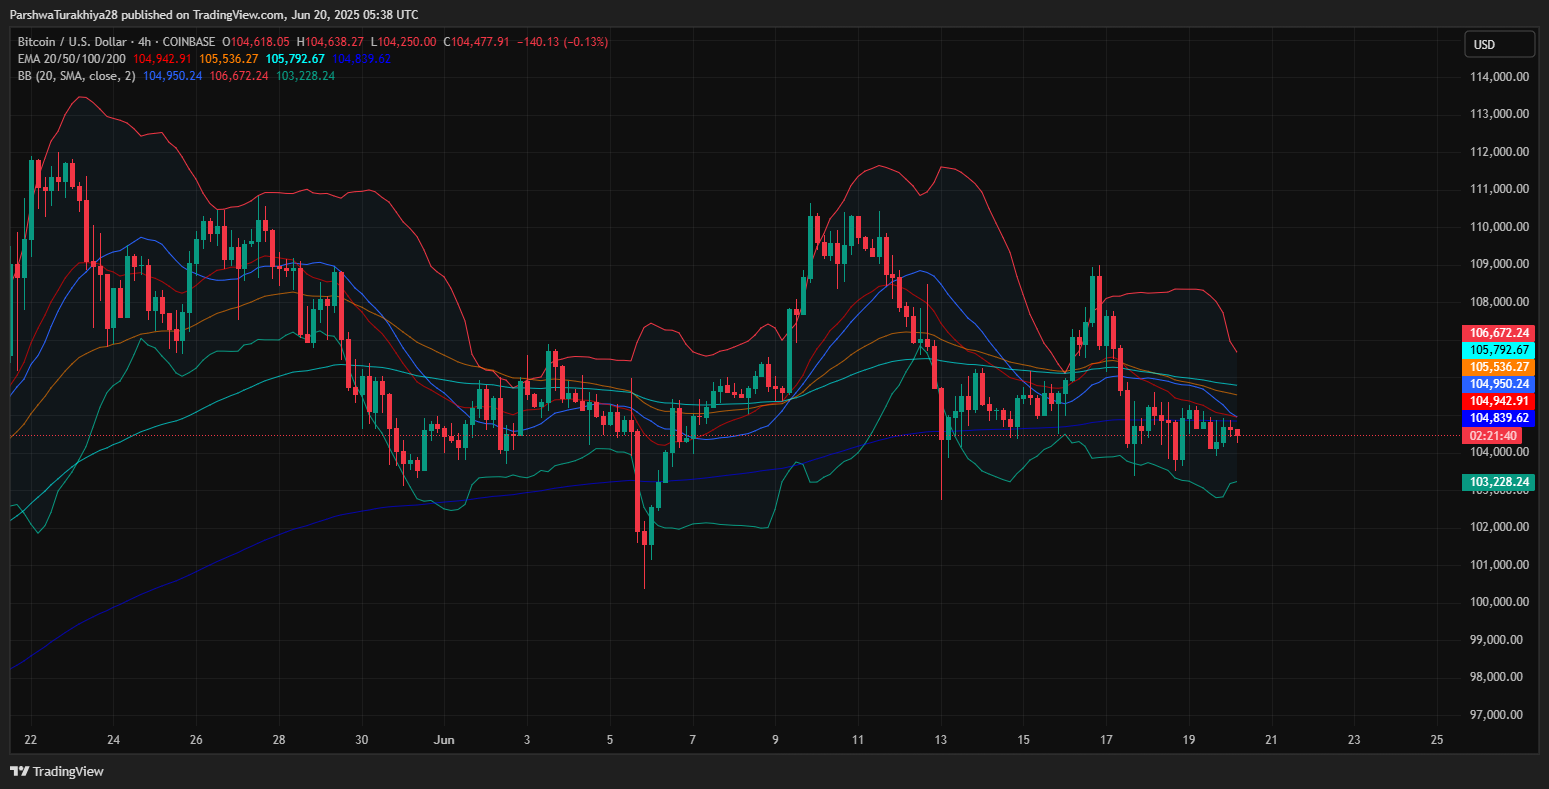
On the 4-hour chart, BTC remains trapped within a symmetrical triangle, bounded by $103,400 as support and $105,600 as resistance. The Bitcoin price has been consolidating below the 20/50/100 EMA cluster ($104,950–$105,792), while the 200 EMA at $106,672 continues to act as a strong ceiling. This compression is mirrored by shrinking Bollinger Band width and a falling ATR, indicating reduced Bitcoin price volatility.
BTC price forecast (Source: TradingView)
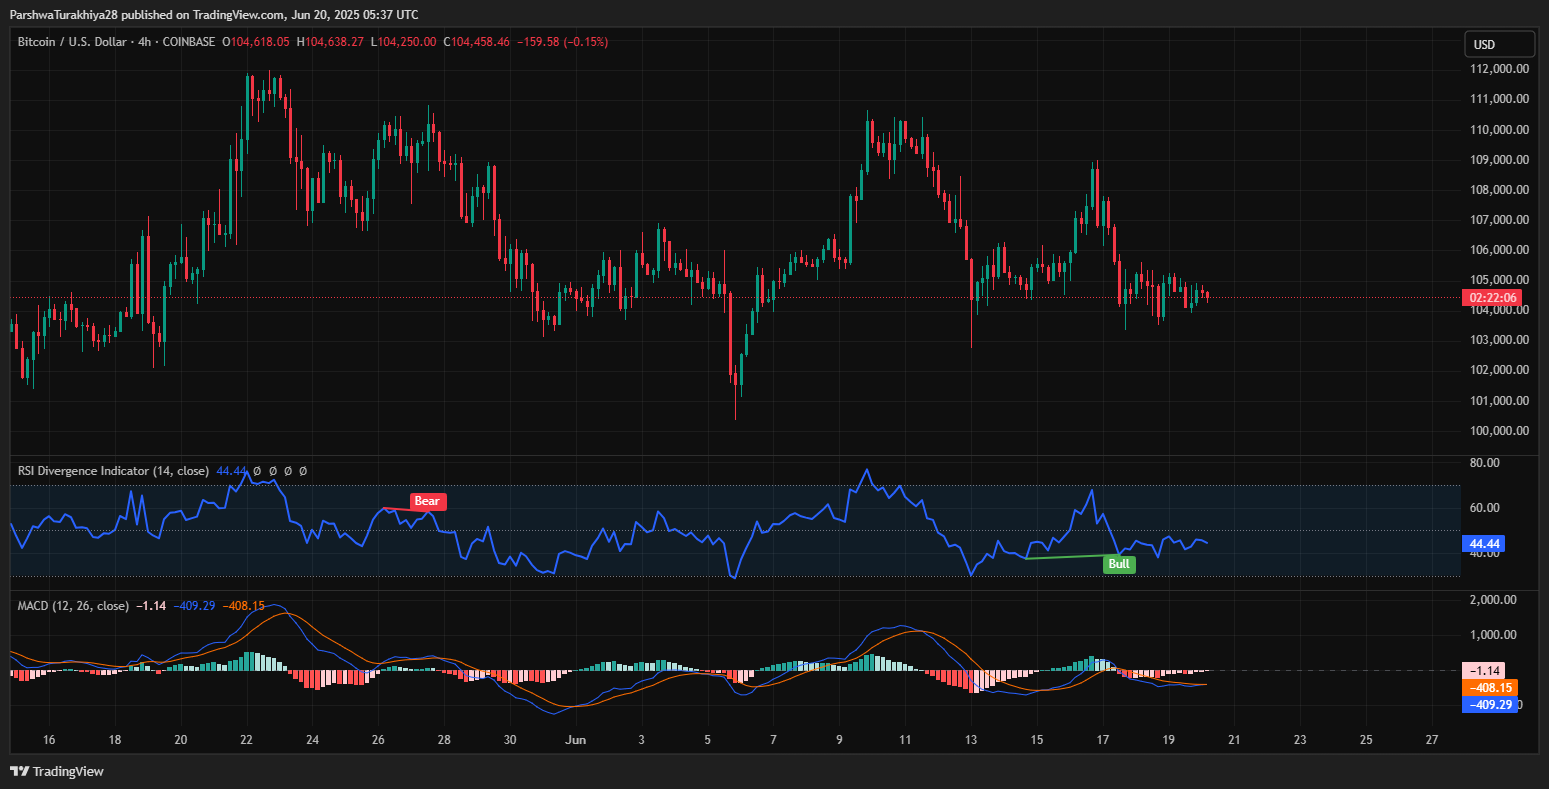
The RSI sits at 44.4, showing mild bearish bias without being oversold. MACD is flat near the zero line with histogram bars tightening — a typical setup before a volatility expansion.
BTC price forecast (Source: TradingView)
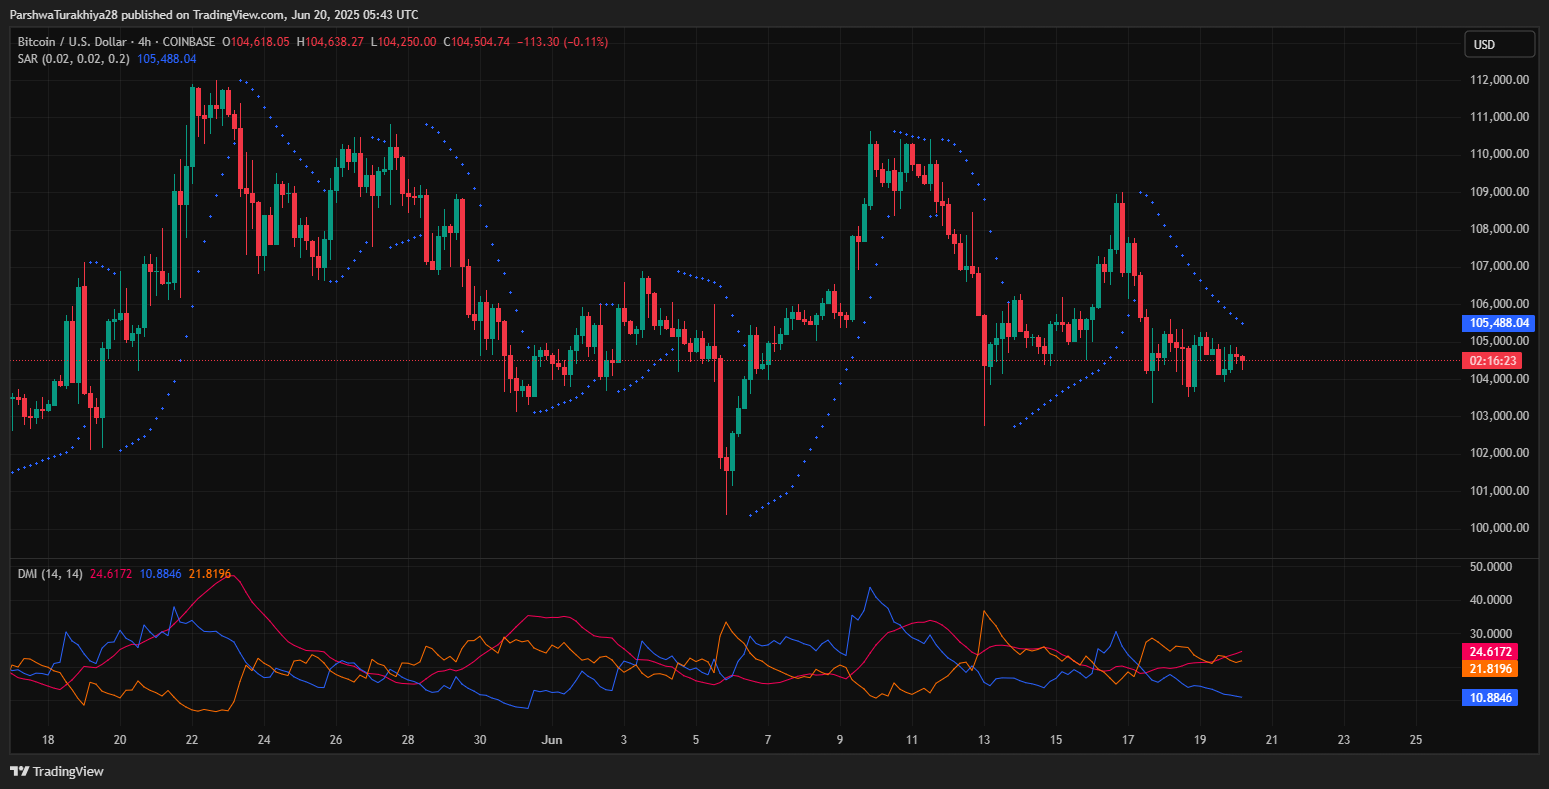
The latest Parabolic SAR dots are now positioned above price candles, reinforcing near-term downside pressure, while the Directional Movement Index shows a weakening ADX, implying indecision.
Why Bitcoin Price Going Down Today?
BTC price forecast (Source: TradingView)
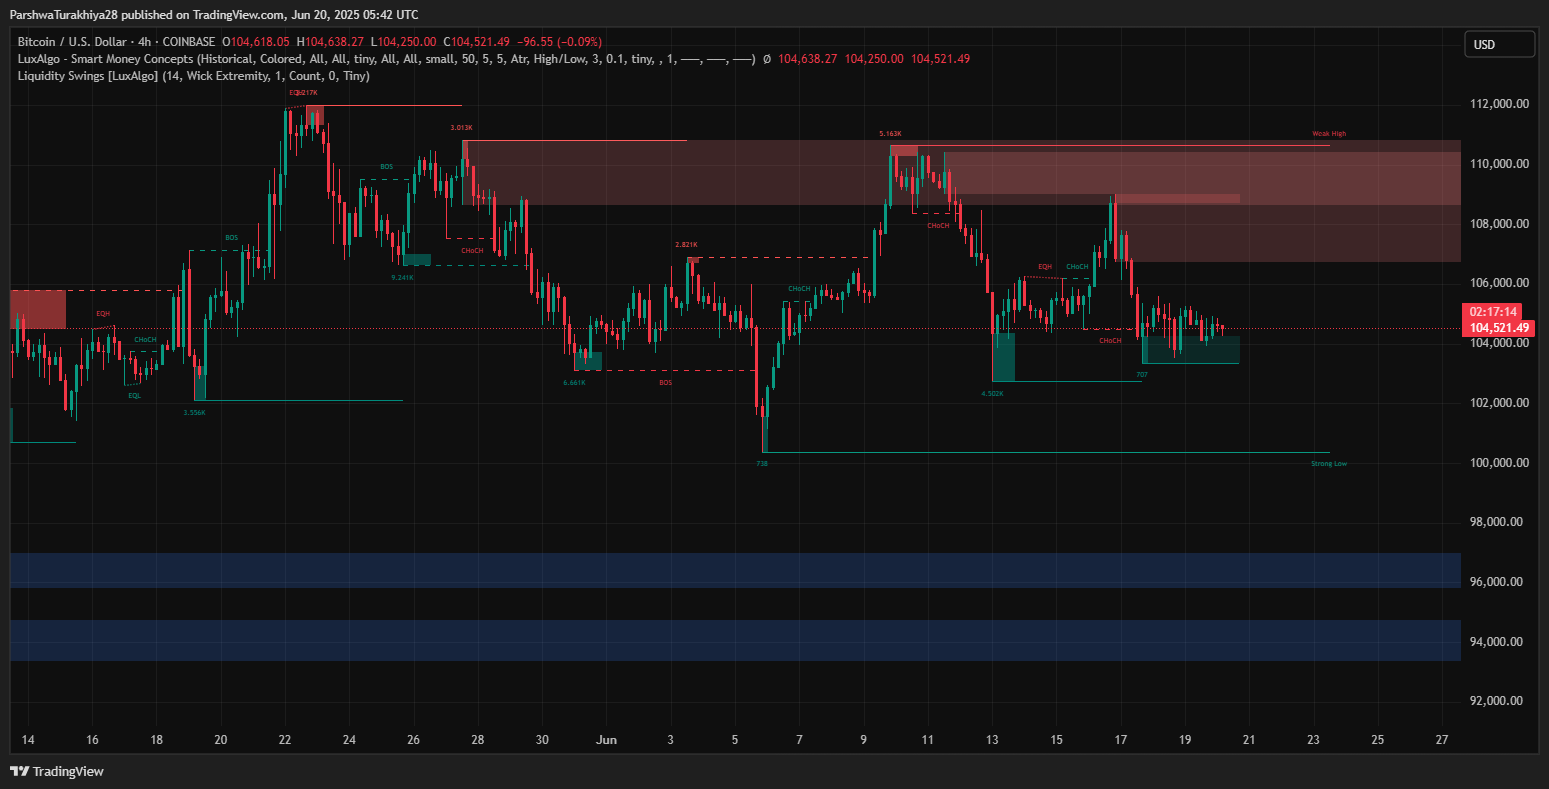
One major reason Bitcoin price going down today is visible on the Smart Money Concept chart. The recent push into the $108,000–$109,000 liquidity zone was met with aggressive selling, as evidenced by a change-of-character (CHoCH) and rejection near the previous BOS area. The failed attempts to establish a higher high above this weak liquidity zone have since triggered a return to equilibrium levels.
BTC is currently trading just above a significant demand block near $103,400. A sustained close below this could expose deeper support layers at $102,000 and $100,600. On the flip side, bulls will need to clear $105,800 to invalidate the current lower high structure.
Bitcoin Options Data Suggests Neutral to Bearish Sentiment
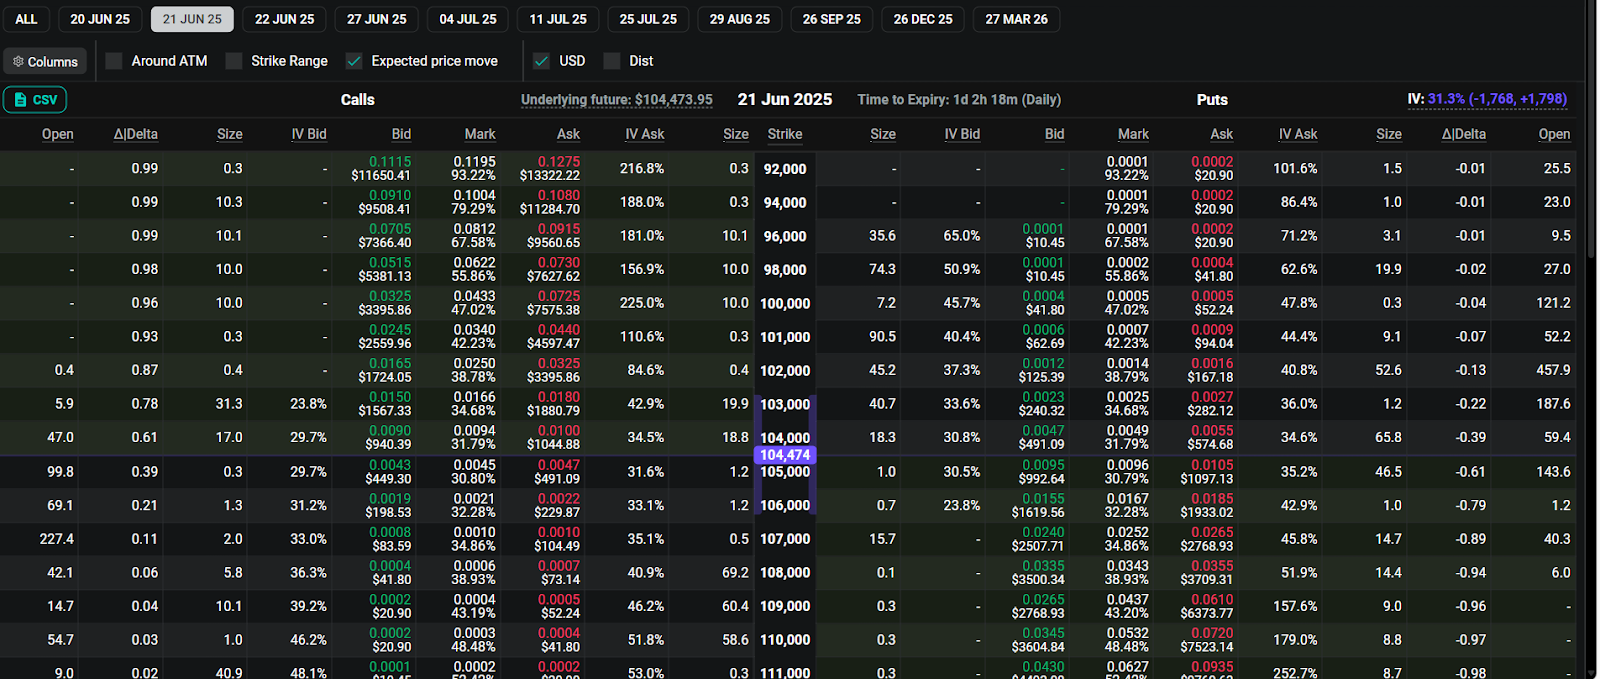
BTC price forecast (Source: TradingView)
Looking at Deribit options expiring on June 21, a large chunk of open interest is concentrated around the $105,000 and $104,000 strikes, with puts outweighing calls slightly in both size and implied volatility.
The implied volatility for ATM contracts remains around 31% for June 21 expiry, hinting at muted expectations for a breakout within the next 24 hours. This aligns with the tight consolidation seen across the 30-minute and 4-hour charts.
Short-Term Outlook: Will BTC Price Break Above $105,500 or Retest $103,000?
BTC price forecast (Source: TradingView)
If Bitcoin price can reclaim $105,500 on a closing basis and break above the descending resistance trendline, bulls may attempt a rally toward $107,000 and eventually retest $108,500. However, the lack of momentum and flattening volume suggest upside may be capped unless fueled by a catalyst.
Conversely, if the $103,400–$104,000 support zone fails to hold, BTC could retest $102,000 and possibly $100,600 — both major liquidity pockets. A break below $100K would only be likely if broader macro sentiment turns sharply risk-off.
Bitcoin Price Forecast Table: June 21, 2025
Disclaimer: The information presented in this article is for informational and educational purposes only. The article does not constitute financial advice or advice of any kind. Coin Edition is not responsible for any losses incurred as a result of the utilization of content, products, or services mentioned. Readers are advised to exercise caution before taking any action related to the company.
Read the full article here


