


Donald Trump’s aggressive stance on international tariffs is shocking the global markets. Along with the global financial conditions, Bitcoin and other coins take a hit as broader market liquidations rise to $2.3 billion over the past 24 hours.
As in the ongoing crash, Bitcoin is now down at $95,300 after recording a 24-hour low at $91,530. Despite the short-term recovery, the overall tone in the Bitcoin price chart remains extremely bearish.
With the viewpoint of market analysts, on-chain data, derivative speculations, and other key signals turning a flashing sell signal, will Bitcoin continue to roll down to its $90,000 support level?
Bitcoin Analysis: Weakened Bulls Draw The Last Line at $95k
In the daily chart, the BTC price trend shows a quick reversal from an overhead resistance trend after facing multiple rejections between January 2017 and January 2021, with a bearish ending to January with a drop of 2.22%. After failing to cross the $106,000 mark, the BTC crash begins.
With four consecutive red candles, Bitcoin is now down to testing the local support trendline, holding the BTC price since November 2024. With the lower price rejection, Bitcoin signals potential demand at critical support levels.
Furthermore, it also avoids a bearish breakdown, hinting at a potential recovery. Supporting the minor bullish chances amid a significantly sharp bearish turn, the low-priced rejection also helps BTC float above the 100-day EMA line.
As BTC finds crucial support elements, the possibility of bulls softening the bearish blows is likely to sustain BTC near the $95K level.
Analyst Reveals Grave Danger in Bitcoin Price Trend
With the price action analysis hinting at a potential recovery with the exhaustion in selling pressure, crypto analyst Martinez Ali hints at an extended correction. In his recent X post, the analyst points out the Bitcoin trader still holding an average profit margin of 3.32%, despite the broader crypto market witnessing a massive crash.
Historically, Bitcoin has formed local bottoms when the profit-to-loss margin drops below 12% since 2022. As the margin currently stands at 3.36%, with the 30-day simple moving average at 7.78%, this reveals a massive downside risk for Bitcoin.
Speculation Arise As Bitcoin Sellers Overcrowd the Market
While the bears dominate the BTC price trend, the speculations in the derivatives market are following through. The BTC long-to-short ratio chart reveals a massive drop in the ratio from 1.02 to 0.191.
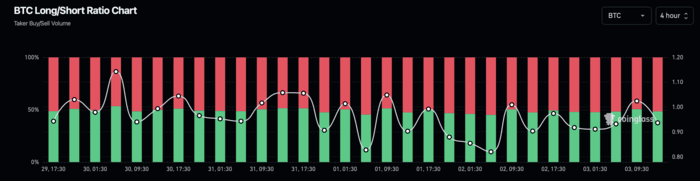

This reveals a sudden surge in bearish positions in the past 24 hours. With the rising bearish positions, the BTC open interest has also dropped by 4.48% to reach $61 billion.
With the key derivatives turning bearish, the funding rate is also taking a hit. It is now down to 0.0006%, revealing extreme weakness among the bullish sentiments.
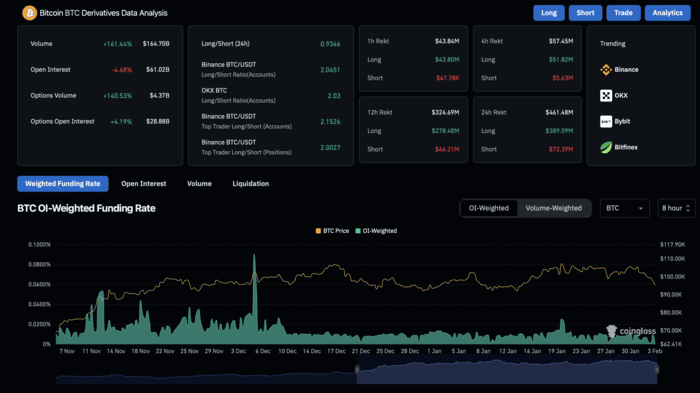

As the buyers are unwilling to pay the premium to hold their long positions, the funding rates could shortly turn negative. With sellers dominating the play and willing to pay the premium to sell BTC, the bearish momentum remains strong.
In conclusion, Bitcoin faces strong bearish pressure near $95,000, with risks of dropping below $90,000 amid $2.3 billion in liquidations and weak derivative signals. However, key support levels may trigger a short-term recovery if selling pressure eases.
Read the full article here


