


- Bitcoin price is nearing its key support level at $100,000; a close below this level will likely trigger a further correction.
- Ethereum experiences a nearly 13% weekly decline, slipping below its critical $2,461 support level.
- XRP nears its daily support at $1.96, a close below this level could push it toward $1.77.
Bitcoin (BTC), Ethereum (ETH), and Ripple (XRP) declined by nearly 5%, 13%, and 7%, respectively, last week as tensions in the Middle East escalated. BTC is nearly at its key support level of around $100,000; a close below this level would trigger further correction. Meanwhile, ETH and XRP slipped below key support levels, suggesting that weakness and correction may carry ETH toward $2,000 and XRP toward $1.77.
Bitcoin could face a deeper correction if it closes below the $100,000 support level
Bitcoin price closed below its 50-day Exponential Moving Average at $102,942 on Saturday and declined 1.13%, reaching a low of $98,200 the following day. At the time of writing on Monday, it hovers around its key level of $100,000.
If BTC continues its correction and closes below $100,000 on a daily basis, it could extend the decline to retest its Sunday low of $98,200.
The Relative Strength Index (RSI) on the daily chart reads 38, which is below its neutral level, indicating strong bearish momentum. Moreover, the Moving Average Convergence Divergence (MACD) on the daily chart showed a bearish crossover. It also shows a rising red histogram bar below its neutral level, suggesting bearish strength and indicating the continuation of a downward trend.
BTC/USDT daily chart
However, if BTC recovers, it could extend the recovery toward its 50-day EMA at $102,942.
Ethereum is set for a downleg as it closes below its 50-day EMA
Ethereum price broke below the lower consolidation level of $2,461 and closed below the 50-day EMA at $2,416 on Friday, falling 7.65% over the next two days. At the time of writing on Monday, it trades at around $2,241.
If ETH continues its correction, it could extend the decline to retest its next support level at $2,000.
The RSI on the daily chart reads 34, nearing its oversold conditions, indicating a strong bearish momentum. The MACD indicators also showed a bearish crossover. It also shows a rising red histogram bar below its neutral level, suggesting bearish strength and indicating the continuation of a downward trend.

ETH/USDT daily chart
On the other hand, if ETH recovers, it could extend the recovery toward its 50-day EMA at $2,416.
XRP could extend the correction if it closes below the $1.96 daily support level
XRP faced rejection from its 50-day EMA at $2.21 on June 17 and declined 10% until Sunday. At the time of writing on Monday, it is nearing its daily support at $1.96.
If XRP breaks and closes below the daily support at $1.96 on a daily basis, it could extend the decline toward its next support at $1.77.
The RSI on the daily chart reads 36, nearing its oversold conditions, indicating a strong bearish momentum. The MACD indicators also showed a bearish crossover. It also shows a rising red histogram bar below its neutral level, suggesting bearish strength and indicating the continuation of a downward trend.
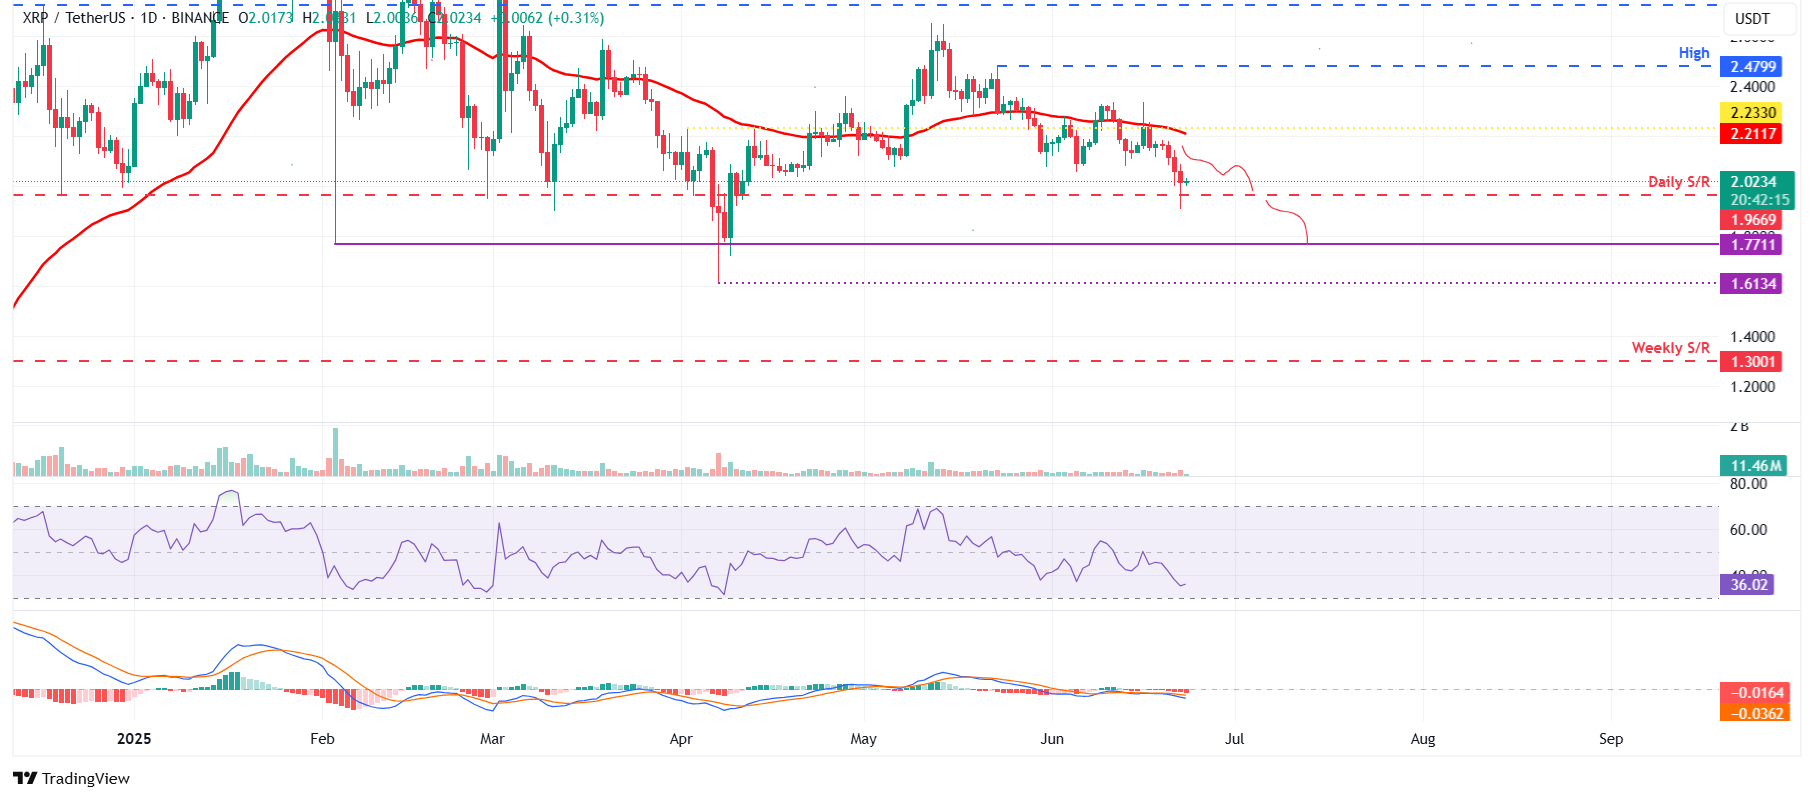
XRP/USDT daily chart
Conversely, if XRP recovers, it could extend the recovery toward its 50-day EMA at $2.21.
Read the full article here


