


Although Bitcoin’s (BTC) momentum has stalled over the past week due to escalating geopolitical tensions in the Middle East, the flagship cryptocurrency appears to be forming a bullish inverse head and shoulders pattern on the three-day chart – significantly increasing the likelihood of a new all-time high (ATH) in the coming months.
Bitcoin Eyeing New ATH Soon?
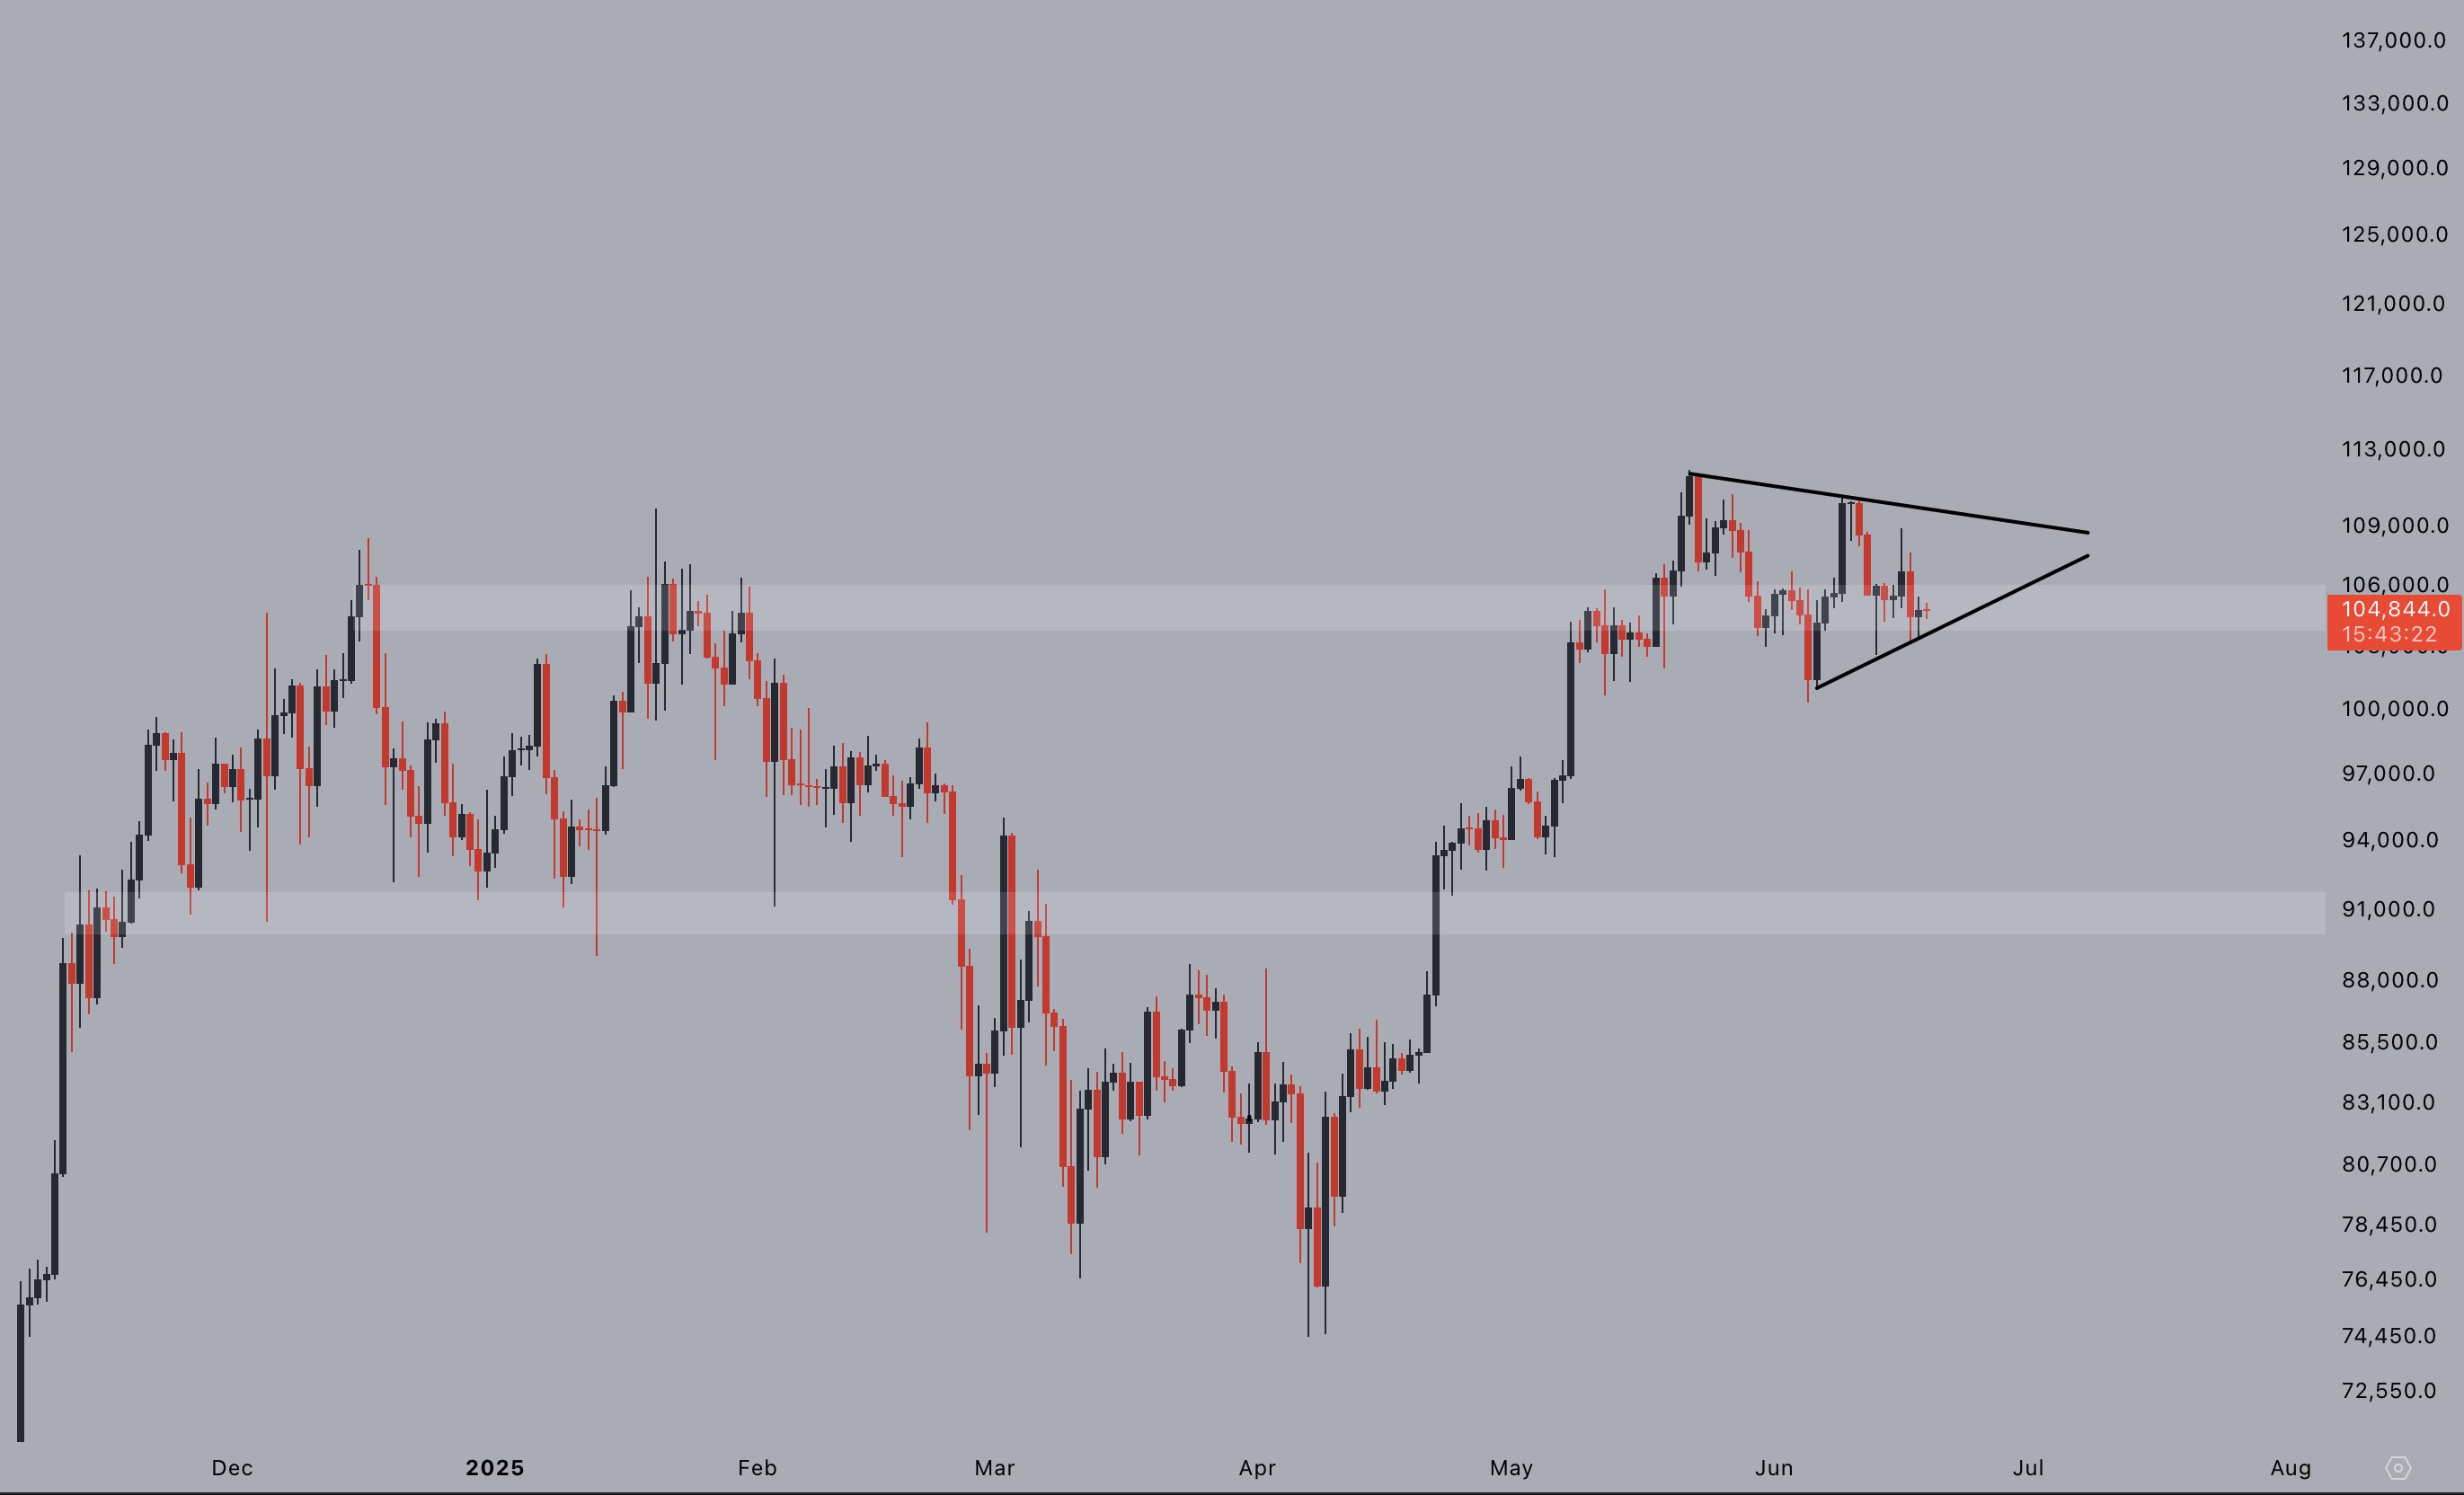
In an X post published today, crypto analyst Mister Crypto highlighted that BTC is forming an inverse head and shoulders pattern on the three-day chart. The analyst shared the following chart, noting that a successful breakout could propel Bitcoin’s price as high as $150,000.
For the uninitiated, the inverse head & shoulders is a bullish chart pattern that signals a potential reversal from a downtrend to an uptrend. It consists of three troughs, a lower low – called the “head” – between two higher lows – called the “shoulders.” This is followed by a breakout above the “neckline” resistance, indicating rising buying pressure.
Despite ongoing uncertainty in the market, analysts remain largely optimistic. For example, noted analyst Jelle pointed out that BTC has formed a major bullish pennant above previous highs – another positive technical signal.
BTC is also poised to benefit from shrinking supply on trading platforms. In an X post shared earlier today, crypto commentator Master of Crypto noted that Bitcoin balances on exchanges are about to fall below two million – the lowest level since 2017.
Depleting BTC balances on exchanges suggest that investors are moving their Bitcoin to long-term storage, reducing the amount available for immediate sale. This supply constraint can create upward pressure on price, especially if demand continues to rise.
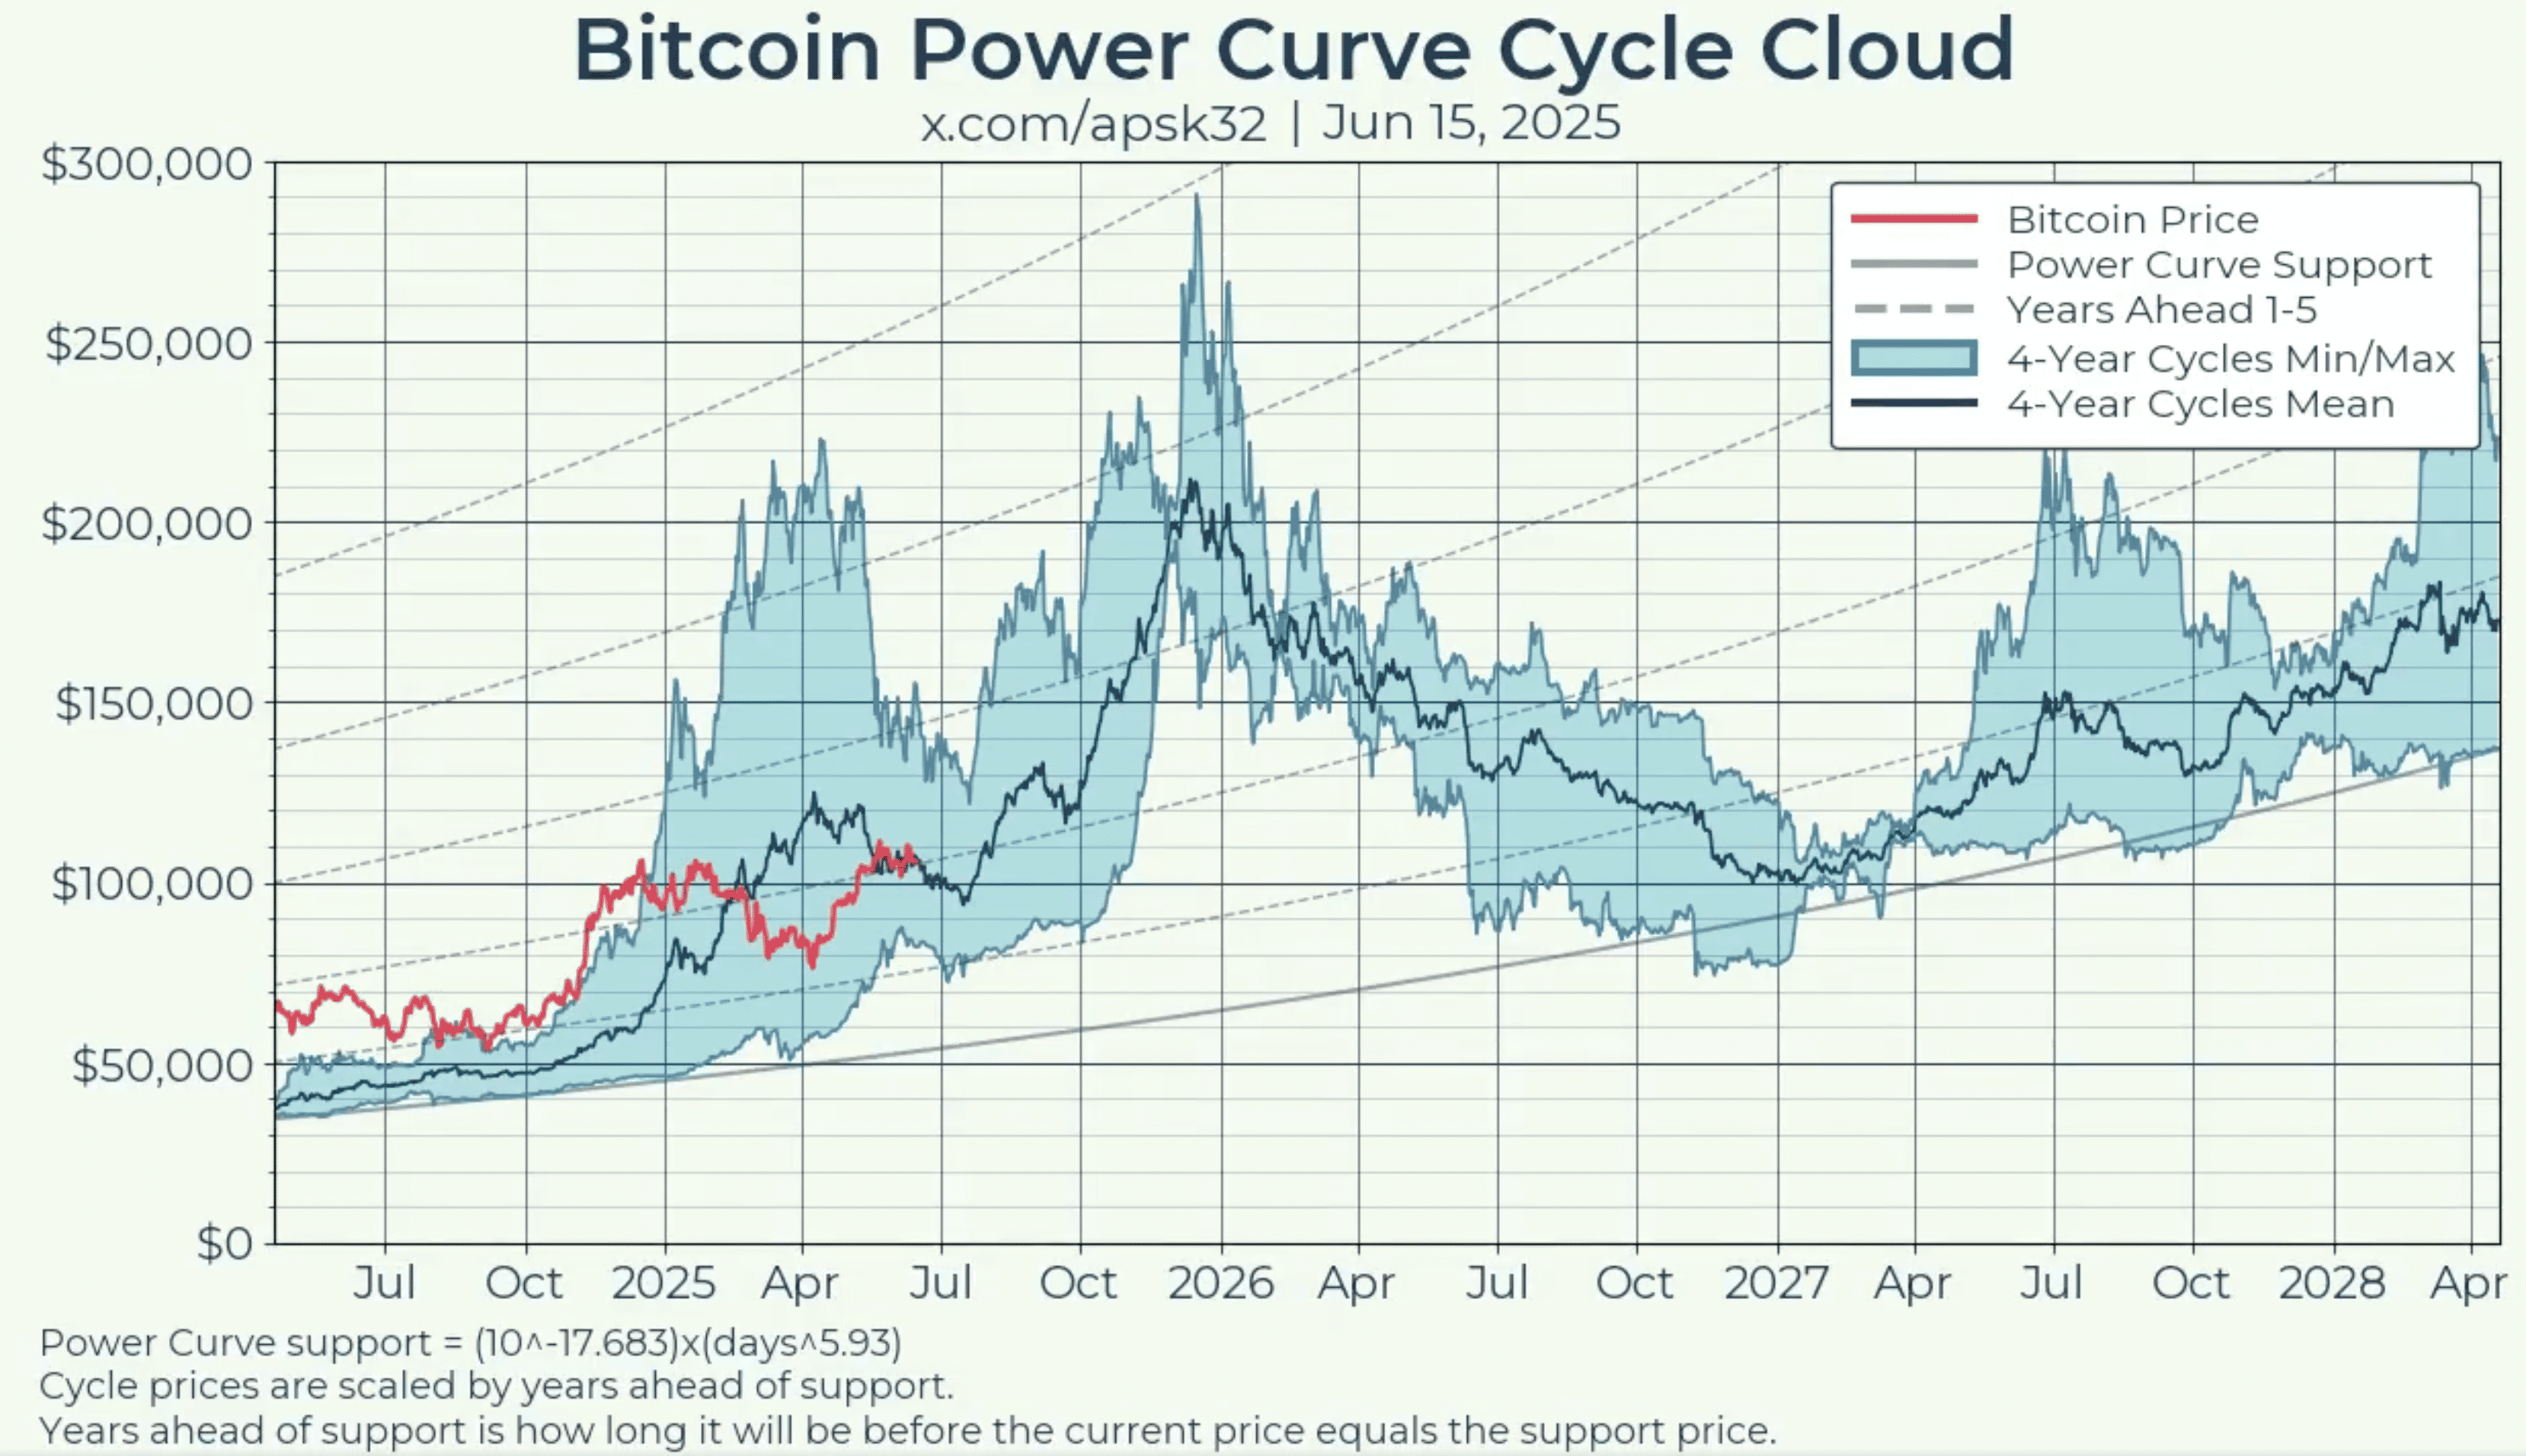
Meanwhile, another Bitcoin analyst, apsk32, highlighted BTC’s ongoing alignment with the power curve cycle. Remarkably, Bitcoin has followed this cycle consistently for 15 years, and if the trend holds, the next cycle top could occur in November or December 2025.
BTC Quantity More Important Than Price
In a separate X post, Rich Dad Poor Dad author Robert Kiyosaki emphasized that the number of BTC one holds is more important than its current price. In a detailed thread, he predicted that Bitcoin could reach as high as $1 million by 2030.
While a $1 million price target may seem ambitious, other analysts also forecast new highs in the near term. For example, CryptoQuant analyst Carmelo Aleman recently projected that BTC could top out at $205,000 by the end of 2025.
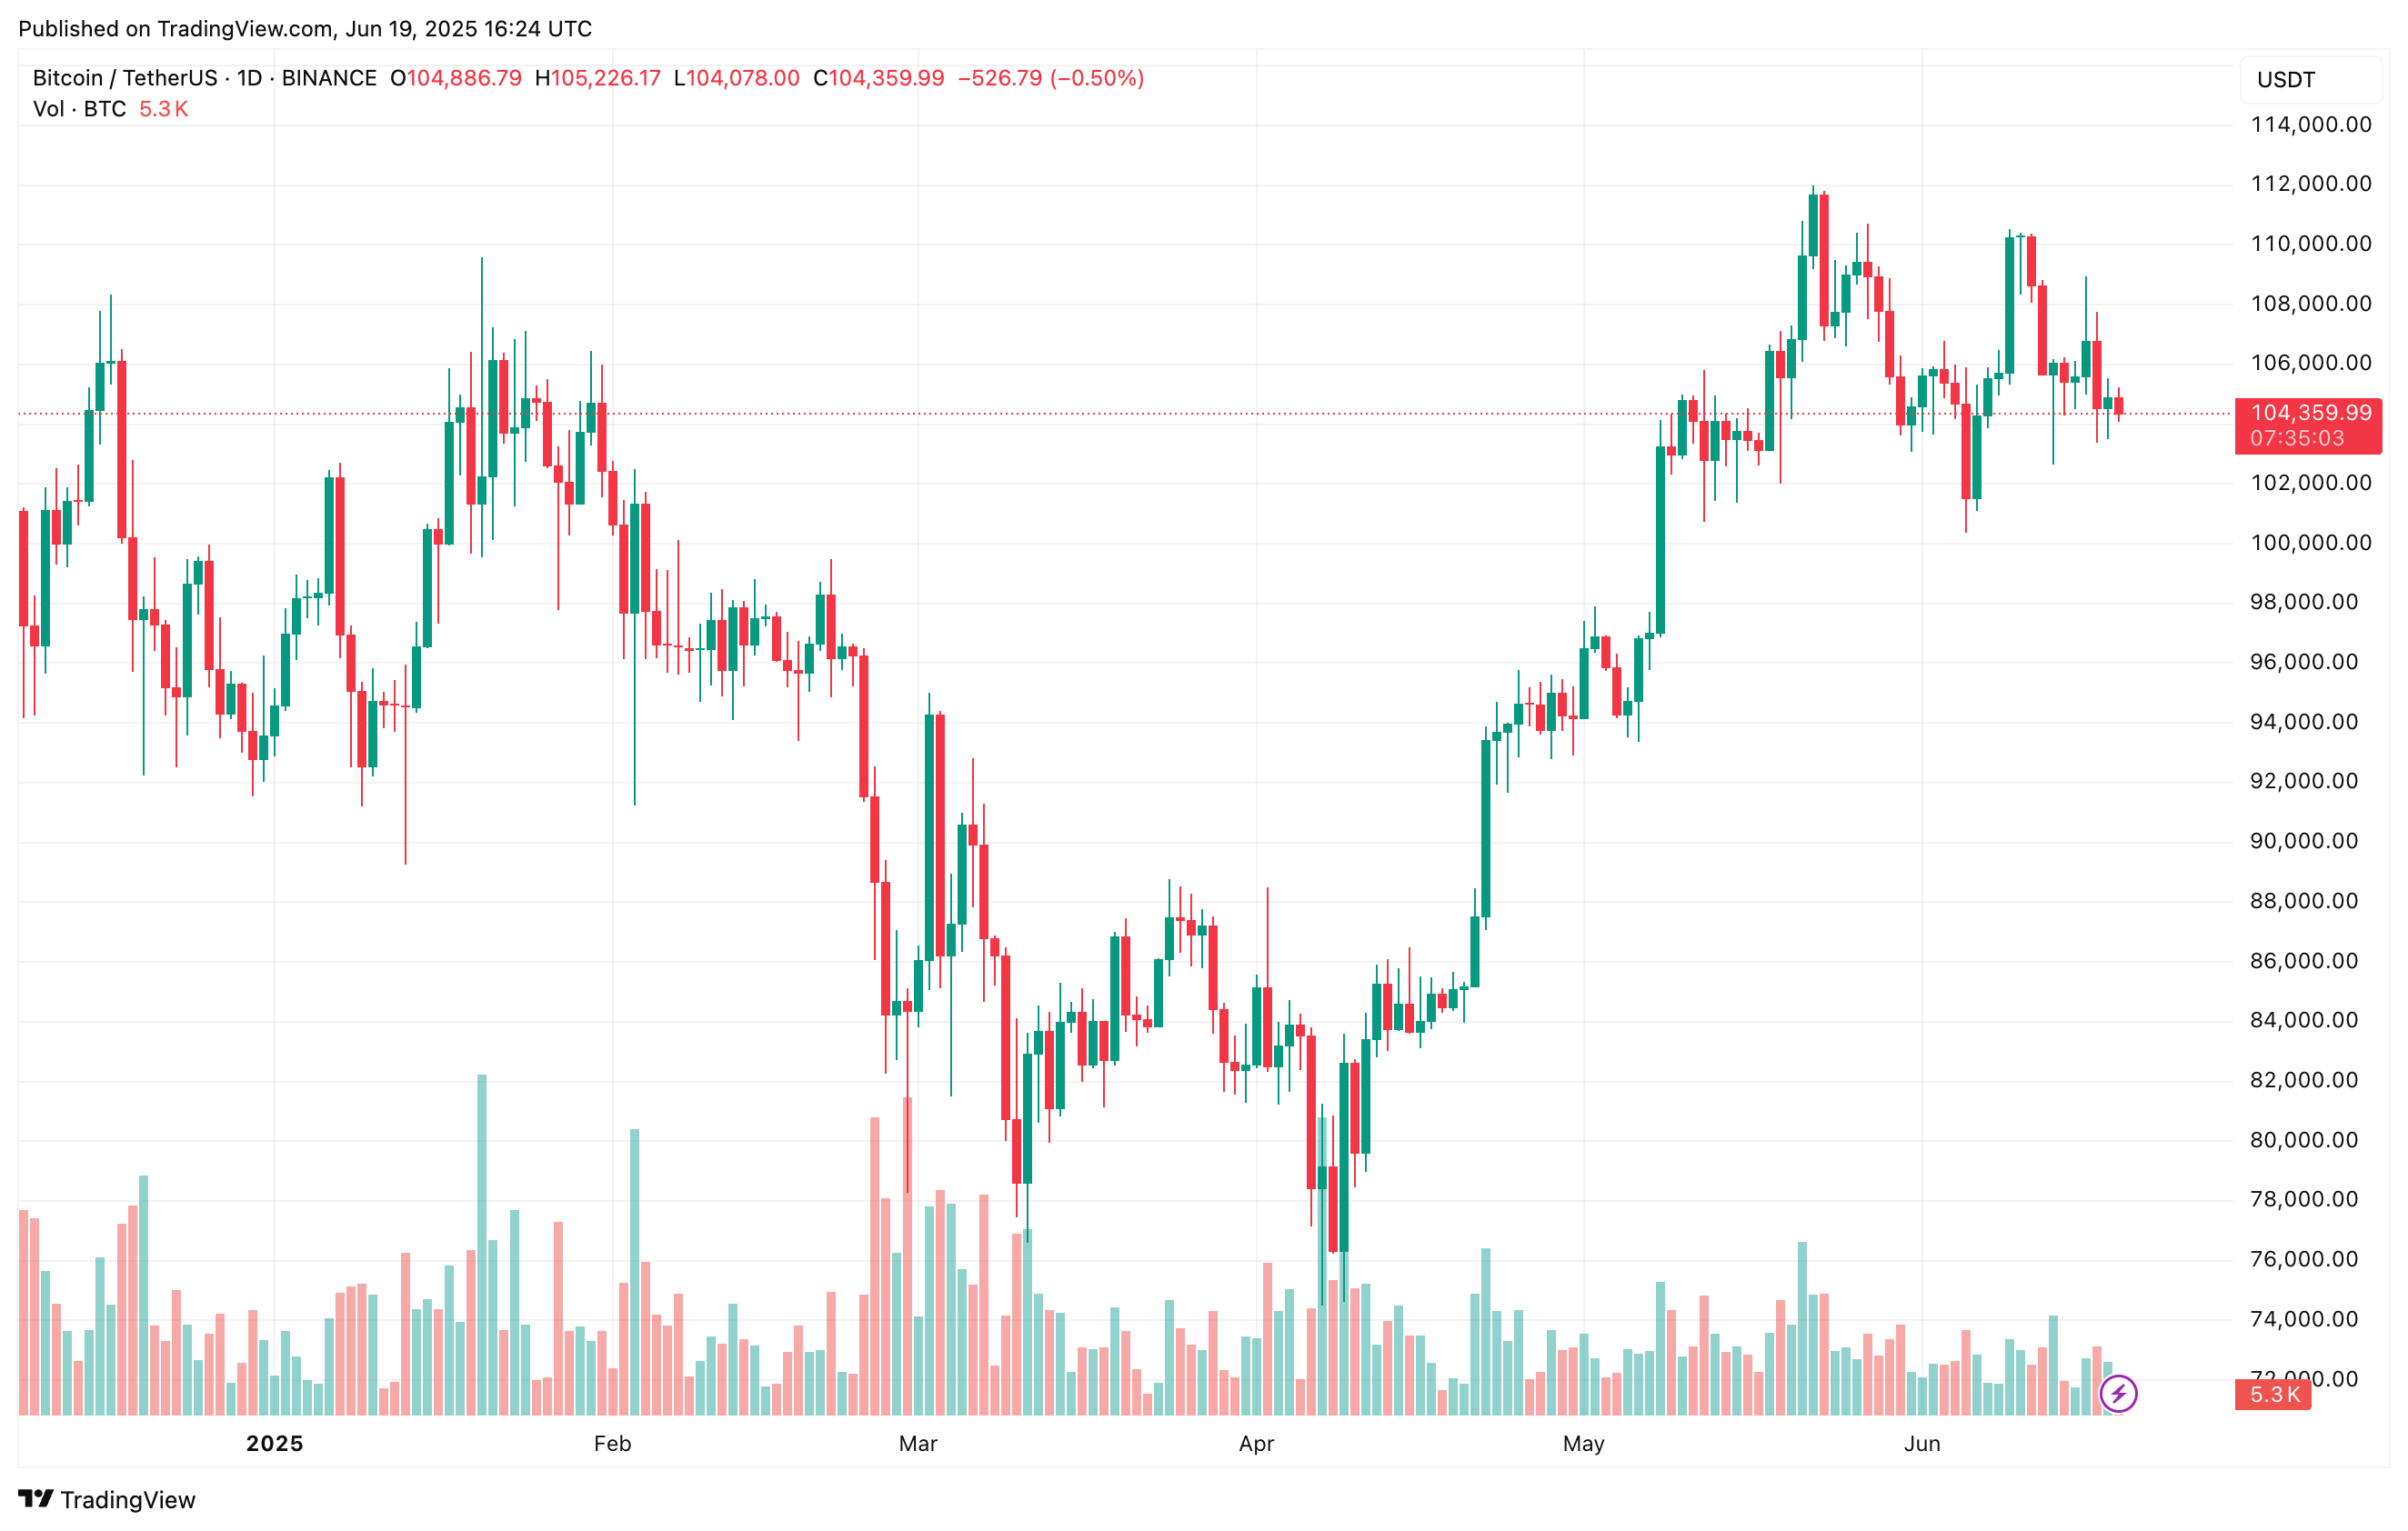
In addition, exchange data suggests an impending supply crunch, as whales continue withdrawing large amounts of BTC while exchange inflows remain subdued. At press time, BTC is trading at $104,359, down 0.1% in the past 24 hours.
Featured image from Unsplash, charts from X and TradingView.com
Read the full article here


