 Skyrockets 973% in Whale Moves Amid $343 Million Market Sell-off")


Key points:
-
BTC price weakness accelerates after the Wall Street open as analysis warns of a “rug pull” at $104,000.
-
Bitcoin bulls have done their best to avoid panic reactions to downside volatility triggers.
-
US dollar strength eyes a comeback after hitting new three-year lows.
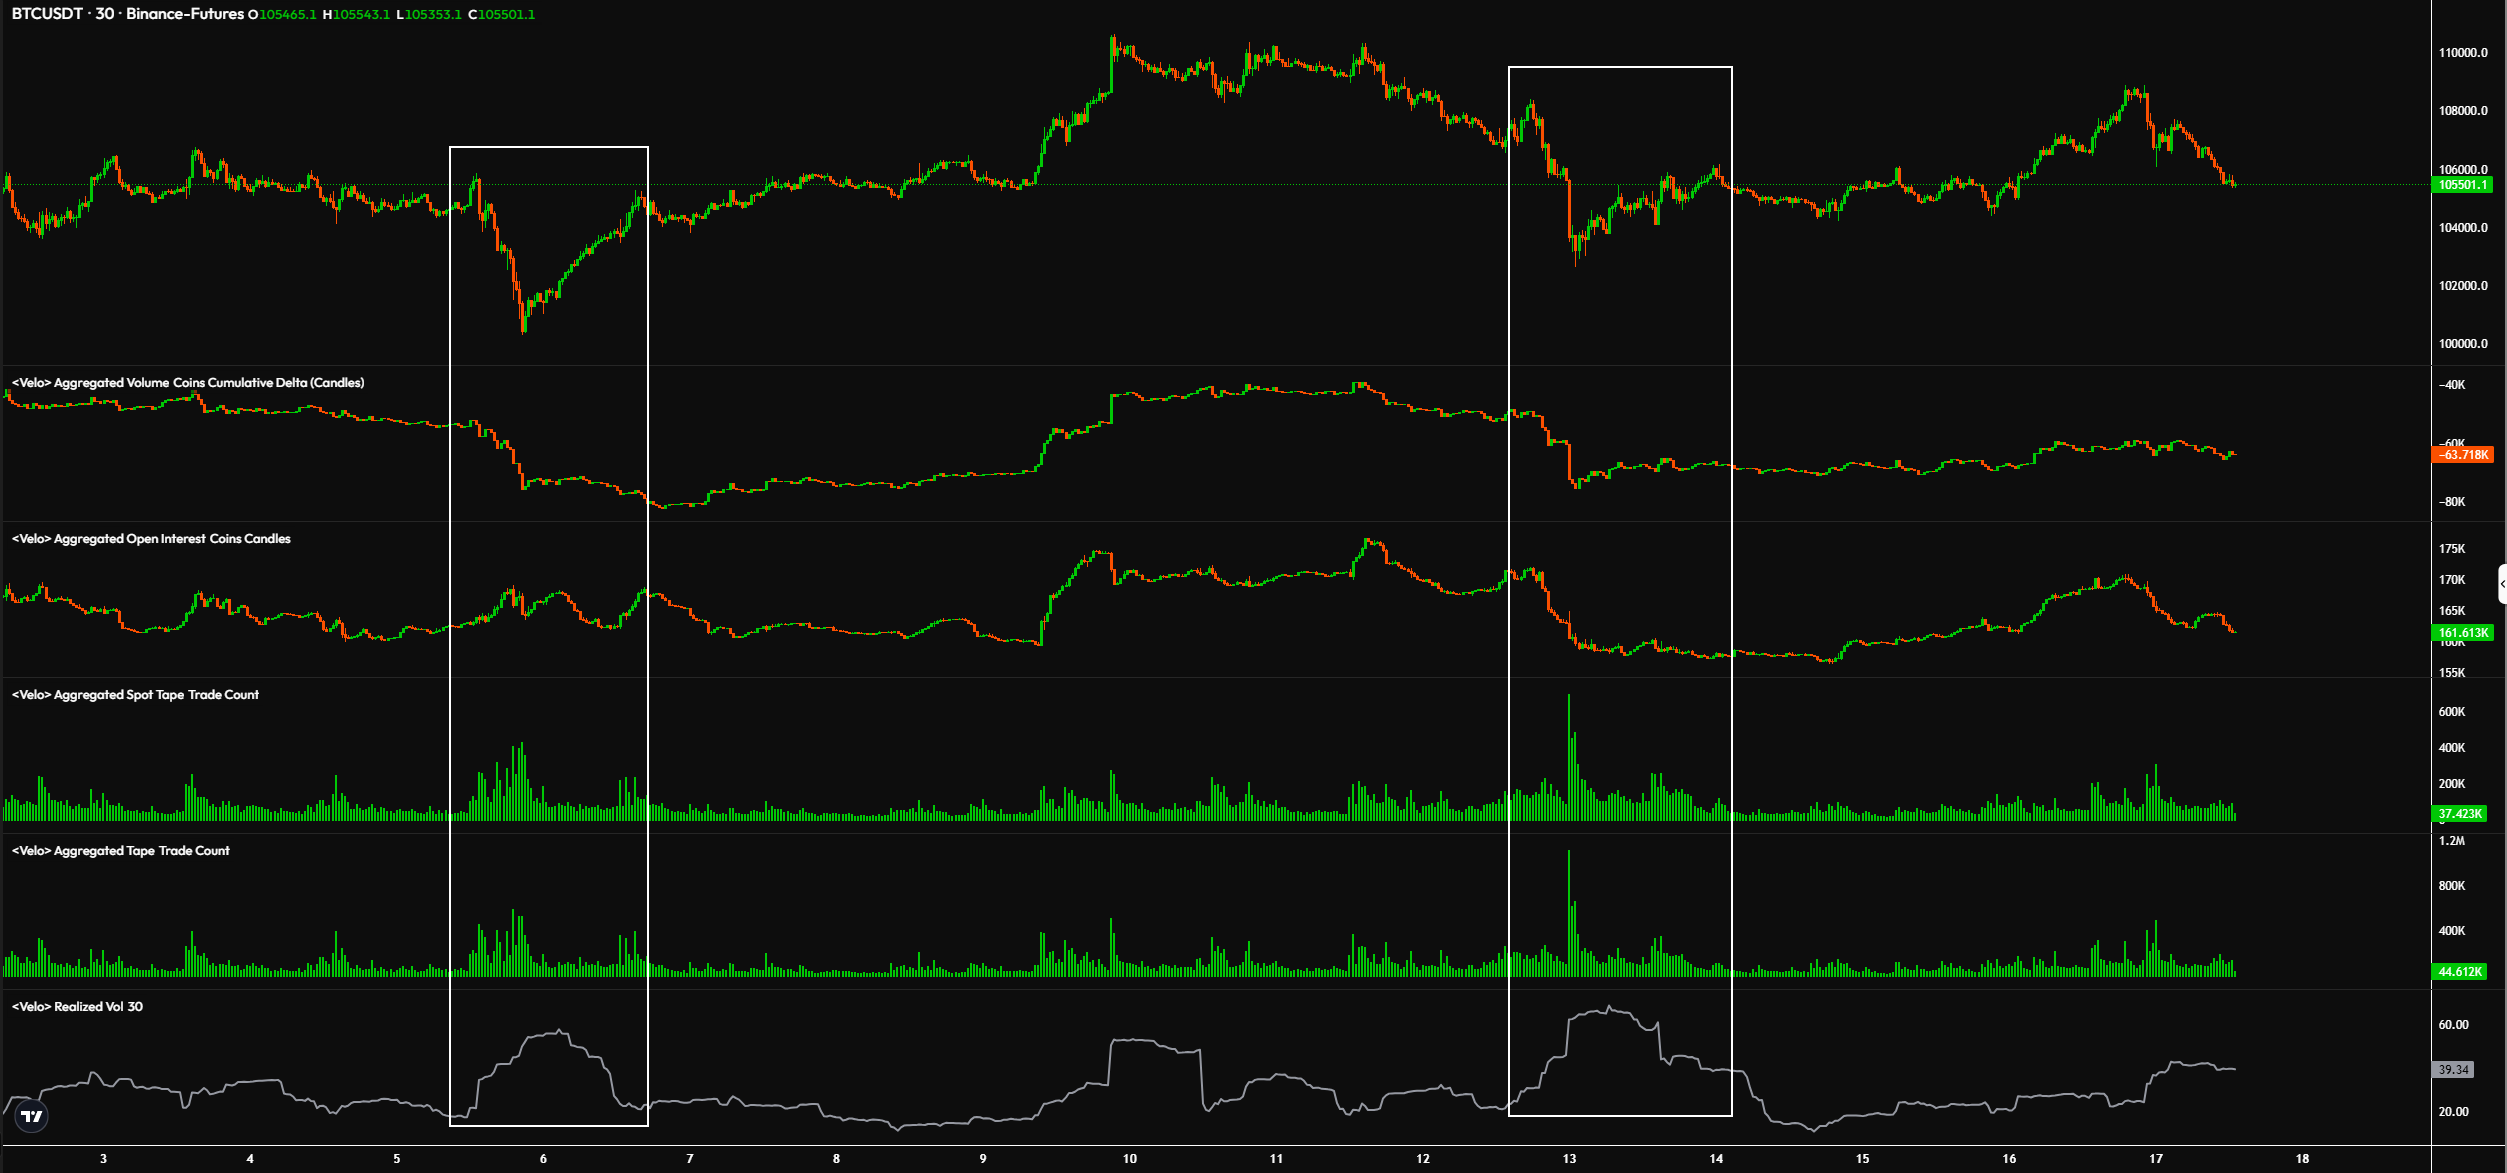
Bitcoin (BTC) broke below $105,000 on June 17 as analysis warned that a “big move” was yet to come.
BTC price move “brewing” — Trader
Data from Cointelegraph Markets Pro and TradingView showed BTC/USD hitting intraday lows of $104,401 after the Wall Street open.
A rare 11 red hourly candles in a row kept bulls firmly in check, with order book analysis warning that downside could easily snowball.
“This is what manipulation looks like in the $BTC order book,” trading resource Material Indicators summarized on X, referring to shifting bid liquidity as price fell.
“If price breaks below $105k, be prepared for a rug pull at $104k.”
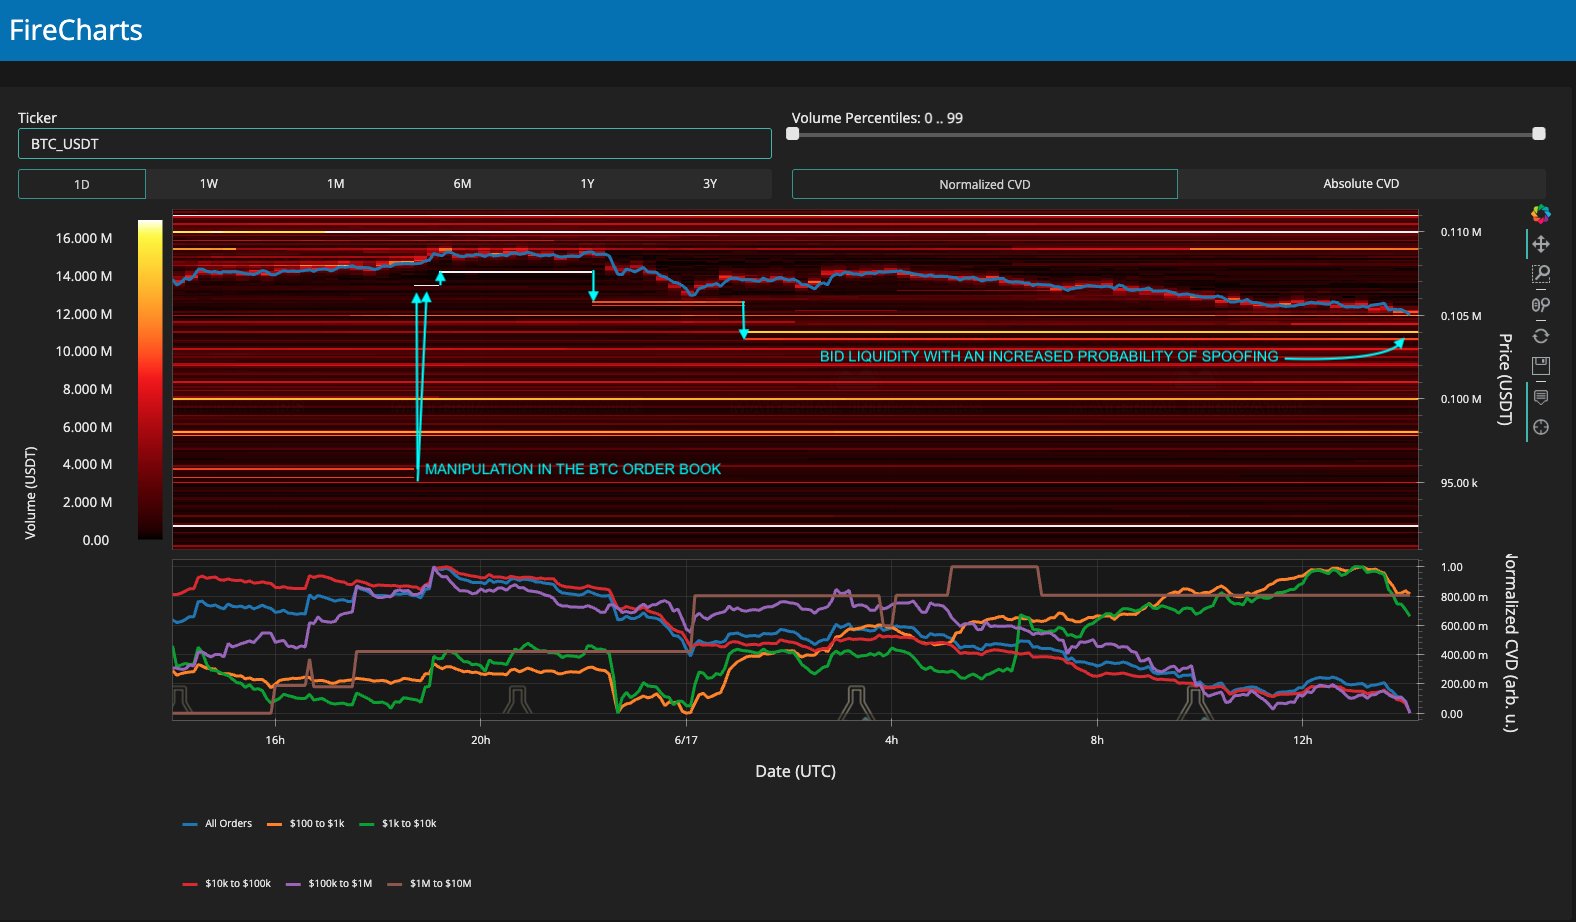
Liquidity “spoofing,” as Cointelegraph previously reported, is a common phenomenon on crypto markets when large-volume traders wish to influence price trajectory.
“If bulls can push above $108k, the door to $110k is open,” Material Indicators acknowledged the day prior.
Discussing overall market strength, popular trader Skew was fairly optimistic. Bitcoin traders, he noted, were demonstrating more restraint than during other recent market pullbacks despite considerable geopolitical pressure.
Volatility, he warned, was nonetheless around the corner.
“For a 3% or so pullback so far market isn’t panicked yet, although on LTF there’s clear hedge bias Previous dips were 5% or so but had aggressive shorting, spot selling & uptick in volatility with sell momentum/Volume,” part of an X post read.
“So this means the big move has yet to occur & is brewing.”
“Deeply oversold” US dollar teases comeback
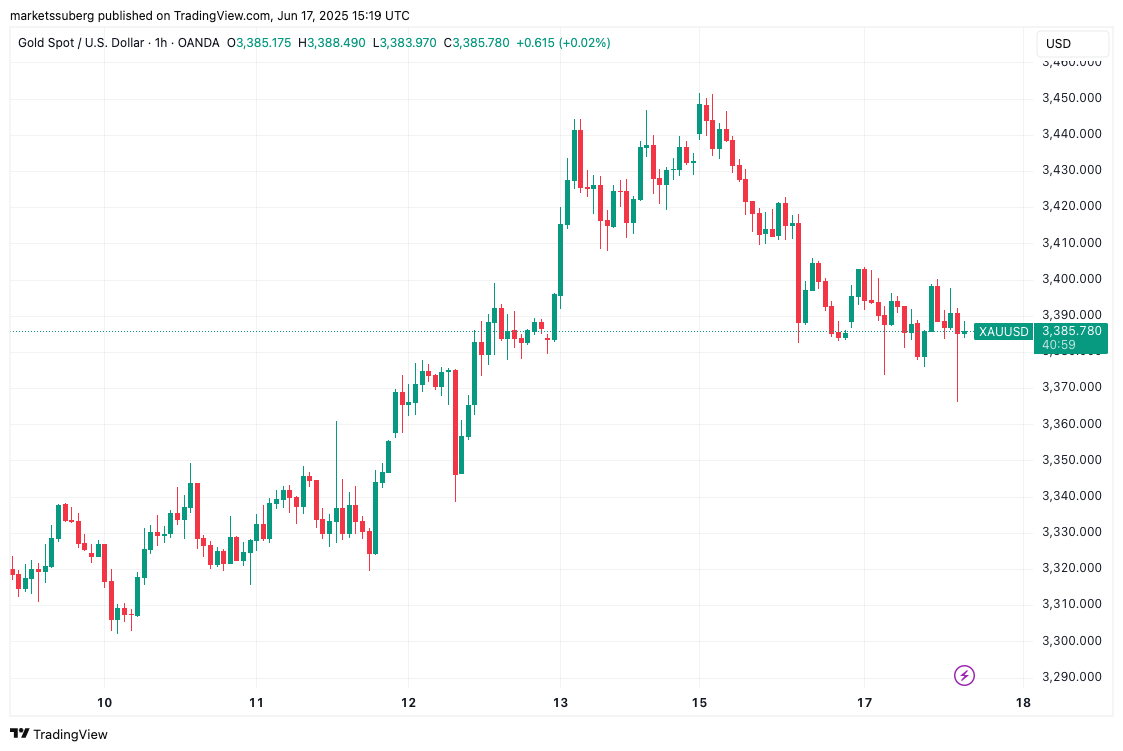
With gold falling and US dollar strength showing signs of bullish divergence, perspectives on the Middle East conflict were far from panicked.
Related: Bitcoin price top metric with 10-year record stays ‘neutral’ at $112K
In ongoing X analysis, trading resource The Kobeissi Letter dismissed the idea that Israel-Iran tensions could spiral into a global war.
‘While gold is strong, it continues to paint a consistent narrative: We are not on the brink of World War 3,” it concluded on the day.
“Oil prices are up ~2% today despite ongoing attacks between Israel and Iran. Meanwhile, the 10Y Yield is nearing 4.50%. Markets say this won’t be a long-term headwind.”
The US dollar index (DXY), which traditionally trades inversely to Bitcoin, teased a recovery from multiyear lows.
“Asset managers are heavily short on the USD. The last time positioning was this bearish, the DXY staged a notable rally,” trader and market strategist Guilherme Tavares reported.
“Additionally, the index is trading near a key support level, and the RSI (14) is deeply oversold, showing signs of bullish divergence.”

This article does not contain investment advice or recommendations. Every investment and trading move involves risk, and readers should conduct their own research when making a decision.
Read the full article here
 Skyrockets 973% in Whale Moves Amid $343 Million Market Sell-off")


