


Key points:
-
Bitcoin is facing selling near $108,000, but the likelihood of a break above it remains high.
-
Several major altcoins remain in a range, but some are showing signs of breaking above their near-term overhead resistance levels.
Bitcoin (BTC) is facing selling just above $108,000, but a positive sign is that the bulls have not allowed the price to dip below the $105,000 level. That suggests the bulls are holding on to their positions as they anticipate a move higher.
Analysts are bullish on Bitcoin’s prospects of hitting a new all-time high in the near term. BitMEX founder Arthur Hayes said on X that easing geopolitical tension in the Middle East and the passage of stablecoin regulations in the United States could propel Bitcoin to a new all-time high.
The bullishness is not limited to Bitcoin; select analysts expect Ether (ETH) to soar to a new all-time high in this cycle. Other altcoins are also likely to play catch-up. Alphractal founder and CEO Joao Wedson said in a post on X that Bitcoin has been outperforming altcoins in the past 60 days, but that may be “a great chance to accumulate altcoins while they’re still lagging.”
Could Bitcoin resume its uptrend? Will the altcoins follow? Let’s analyze the charts of the top 10 cryptocurrencies to find out.
Bitcoin price prediction
Bitcoin’s relief rally is facing selling near the downtrend line, indicating that the bears are trying to form a lower high.

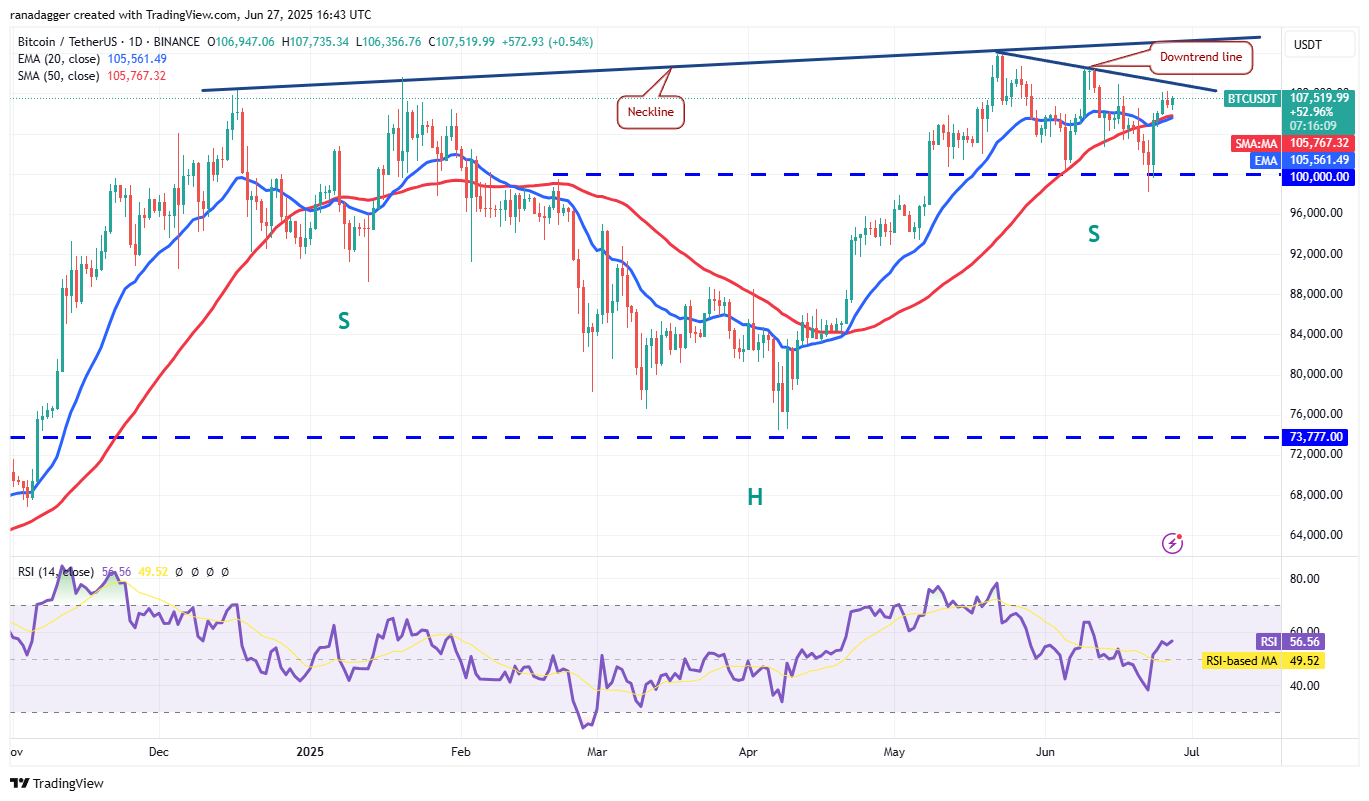
The 20-day exponential moving average ($105,561) is sloping up gradually, and the relative strength index (RSI) is just above the midpoint, signaling that bulls have an edge. If buyers drive the price above the downtrend line, the developing descending channel pattern will be invalidated. That could catapult the price to the neckline of the inverse head-and-shoulders pattern near $114,000. A break and close above the neckline will complete the bullish setup, which has a target objective of $150,492.
Sellers are likely to have other plans. They will try to pull and maintain the price below the moving averages. If they do that, the BTC/USDT pair could extend its stay inside the descending triangle for some more time.
Ether price prediction
Ether has been clinging to the 20-day EMA ($2,466) since Tuesday, signaling that the bulls have maintained their pressure.
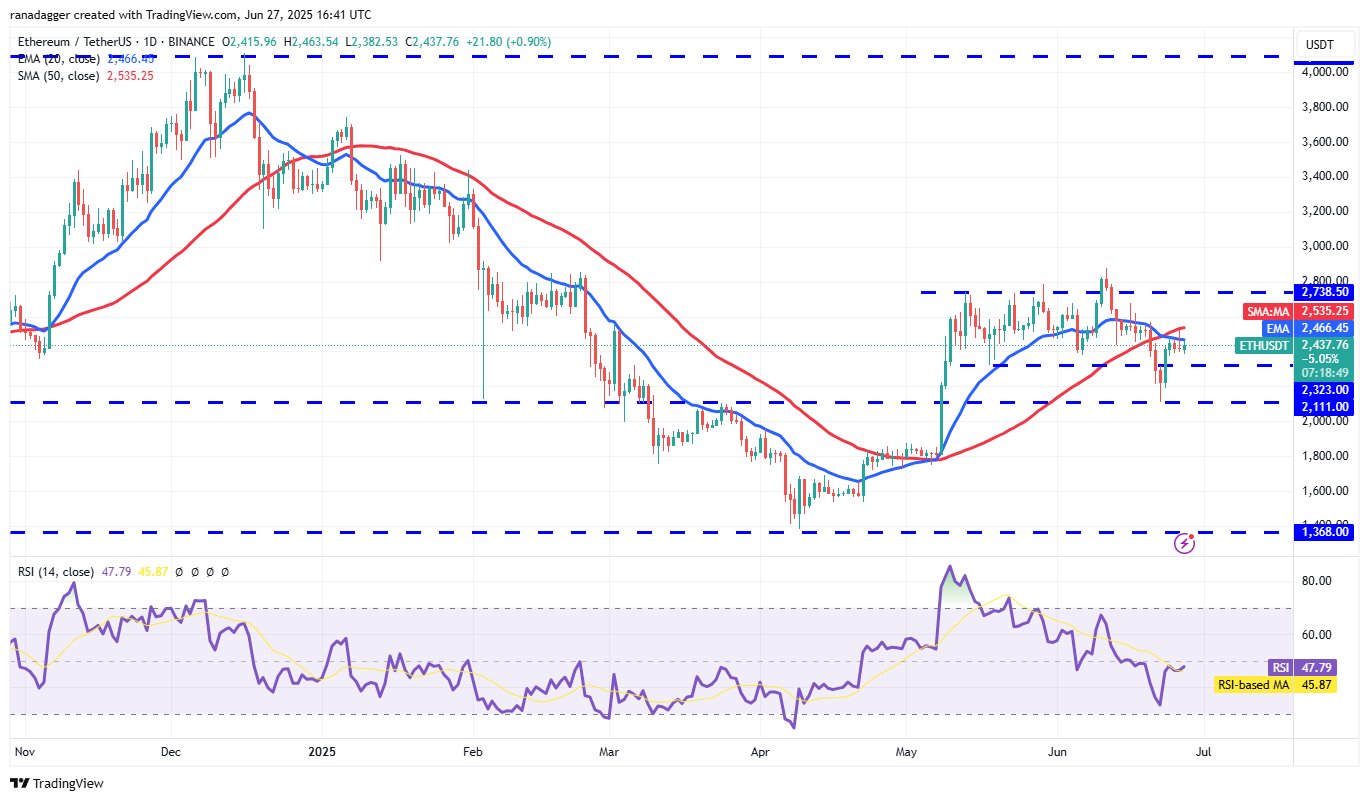
If buyers overcome the barrier at the 50-day simple moving average ($2,535), the ETH/USDT pair could climb to the $2,738 to $2,879 resistance zone. Sellers are expected to defend the overhead zone, but if buyers bulldoze their way through, the pair may skyrocket to $3,437.
On the contrary, if the price turns down sharply from the 50-day SMA, it suggests that the higher levels are attracting sellers. A break below $2,323 opens the gates for a fall to the breakout level of $2,111.
XRP price prediction
Buyers failed to push XRP (XRP) above the 50-day SMA ($2.26), indicating a lack of demand at higher levels.
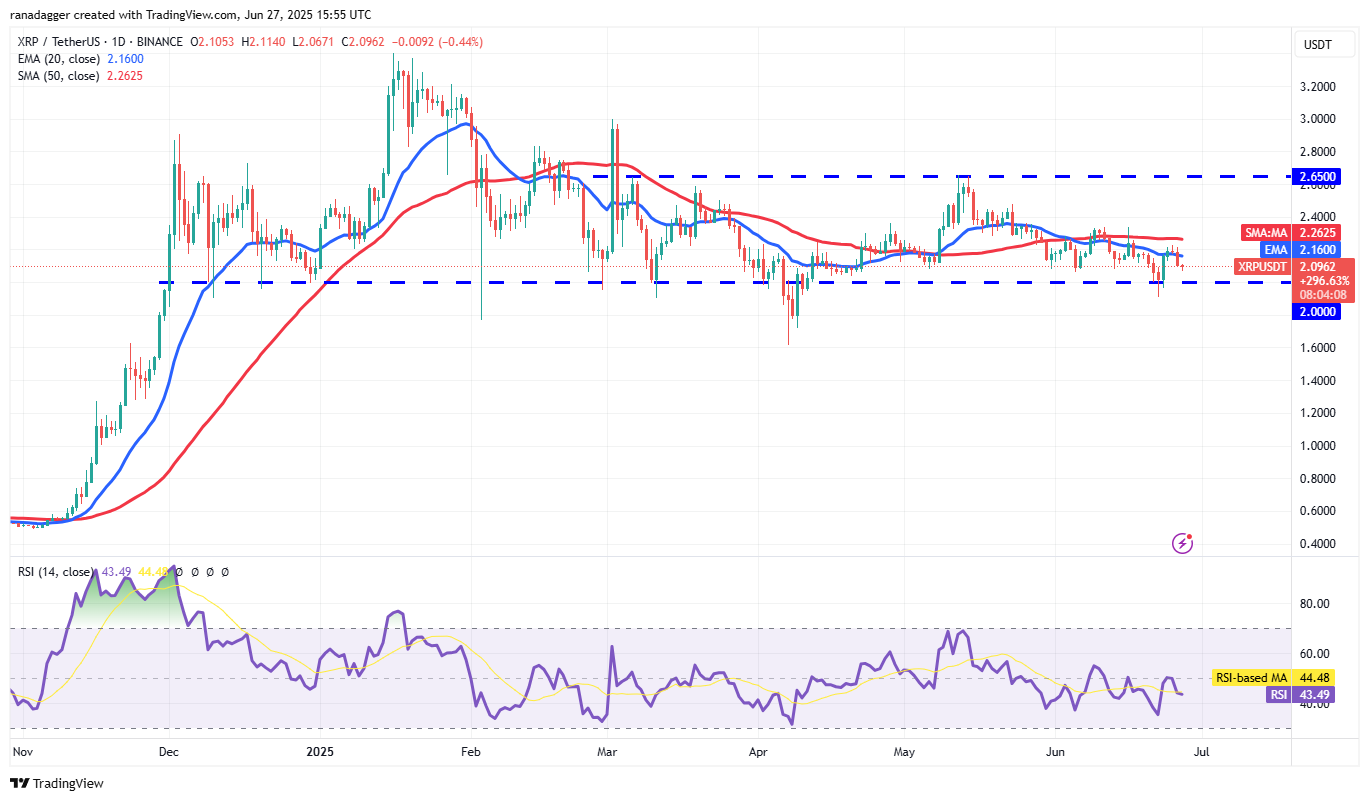
Sellers will try to strengthen their position by pulling the price below the $2 support. If they manage to do that, the XRP/USDT pair could start a downward move toward the critical level at $1.61. Buyers will try to halt the decline at $1.61 because a break below it may sink the pair to $1.28.
The bulls will have to push the price above the $2.34 resistance to signal that the pair may remain range-bound between $2 and $2.65 for a while longer.
BNB price prediction
BNB (BNB) turned down from the resistance line of the descending channel pattern on Wednesday, but the bulls have not given up much ground.
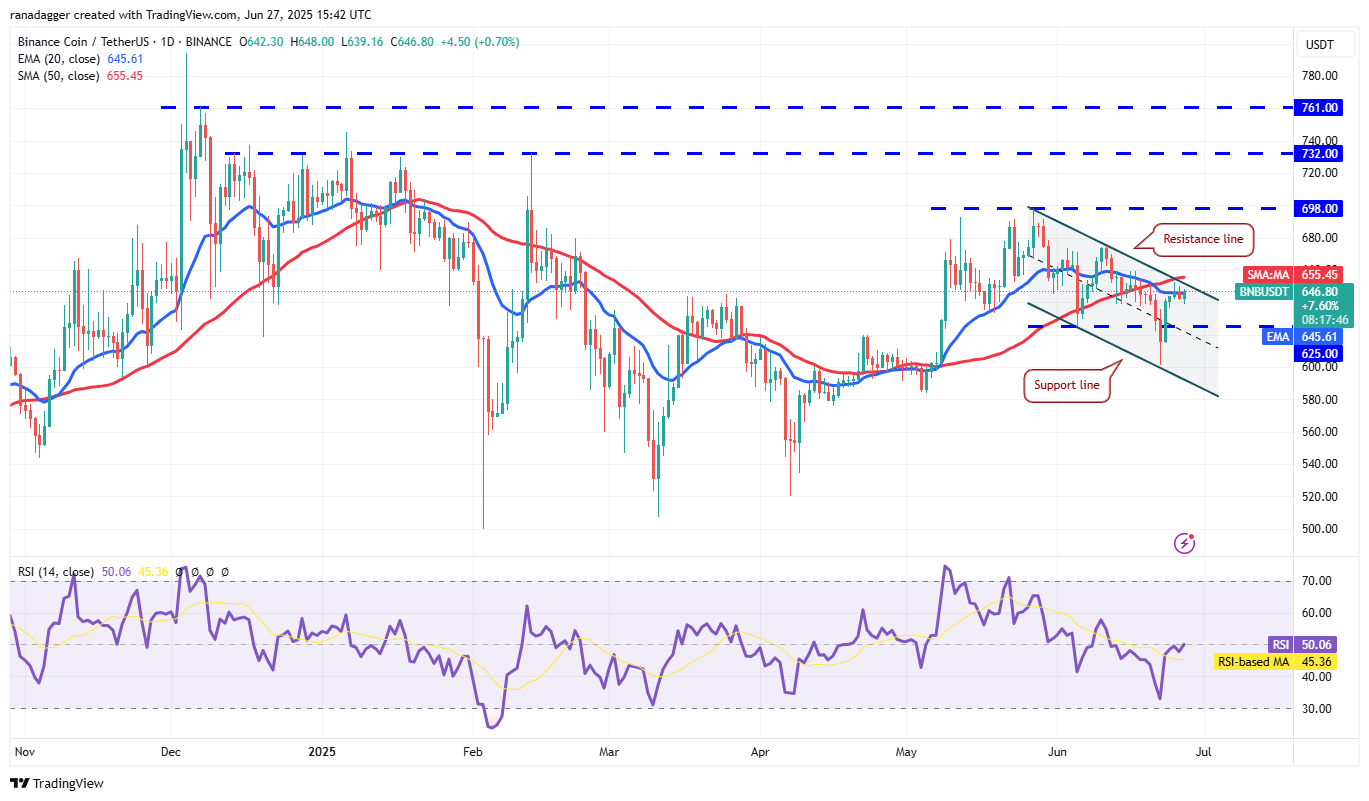
That suggests the bulls are not hurrying to exit their positions. That enhances the prospects of a break above the resistance line. If that happens, the BNB/USDT pair could rally to $675 and, after that, to $698.
The critical support to watch on the downside is $625. A break below $625 indicates that the pair may extend its stay inside the channel for some more time. The pair could fall to $615 and then to the support line.
Solana price prediction
Solana (SOL) turned down from the 20-day EMA ($146) on Thursday, but the bulls are trying to defend the $140 level.
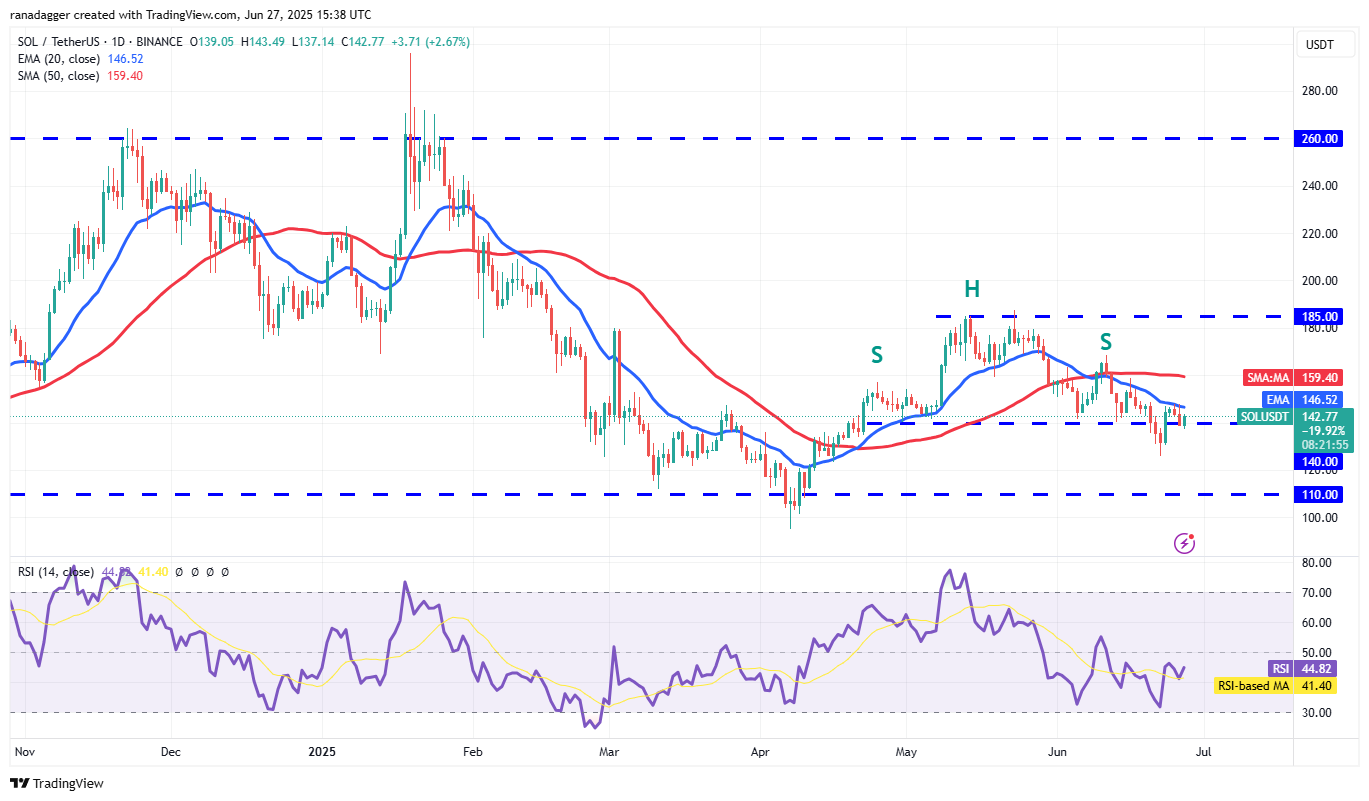
If the price turns up from $140 and breaks above the 20-day EMA, it suggests that the bulls are trying to form a higher low. That opens the doors for a rally to the 50-day SMA ($159), bringing the $140 to $185 range into play.
Instead, if the price turns down from the 20-day EMA and skids below $140, it signals that the bears remain in command. The SOL/USDT pair could drop to $123 and subsequently to the solid support at $110.
Dogecoin price prediction
Dogecoin (DOGE) is facing selling at the 20-day EMA ($0.17), but the bulls have not ceded much ground to the bears. That increases the likelihood of a break above the 20-day EMA.
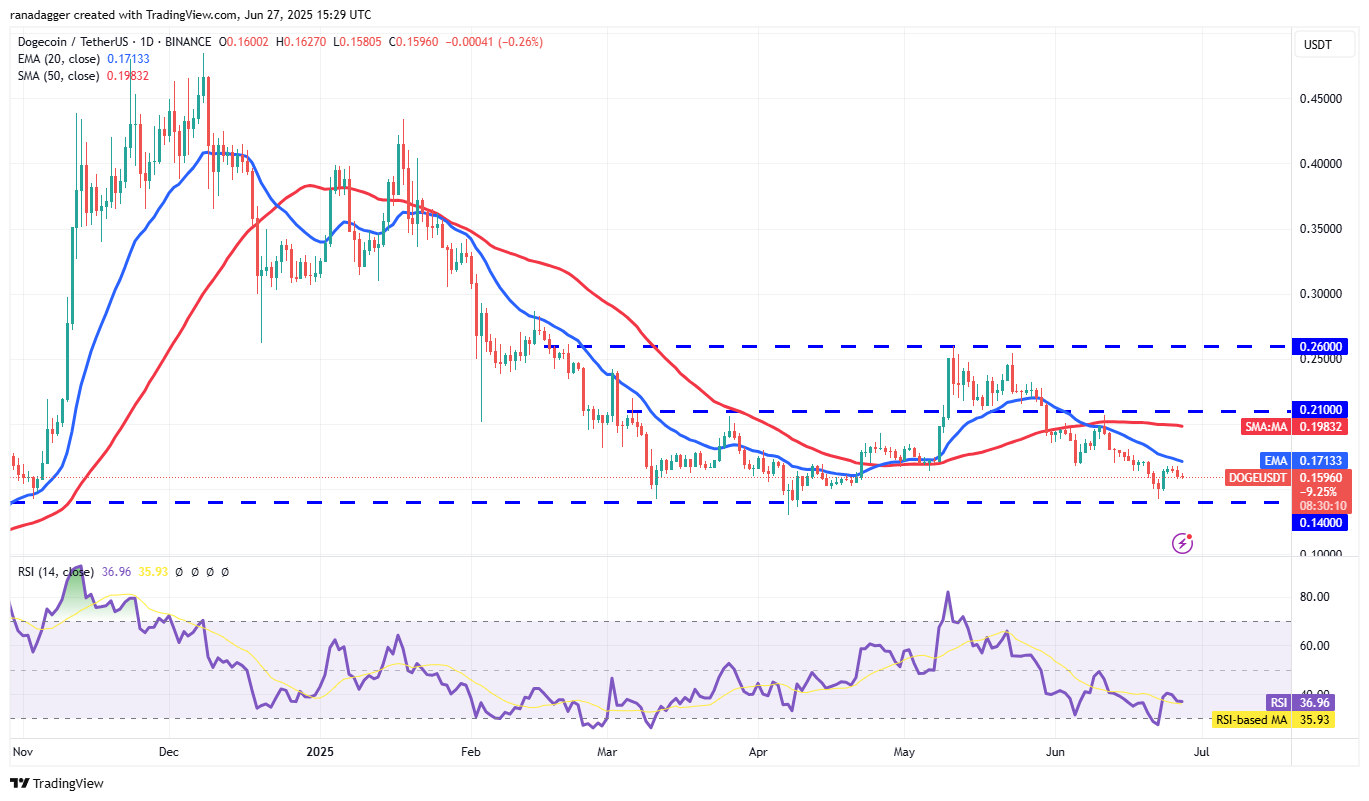
If the 20-day EMA is taken out, the DOGE/USDT pair could climb to the 50-day SMA ($0.19). Sellers will try to defend the 50-day SMA, but the pair could surge to $0.26 if the bulls prevail.
Instead, if the price turns down from $0.21, it suggests that the pair could remain in the bottom half of the large range between $0.14 and $0.26. The pair could plummet to $0.10 if the $0.14 support breaks down.
Cardano price prediction
Cardano (ADA) is facing selling at the 20-day EMA ($0.60), indicating that the bears remain in control.
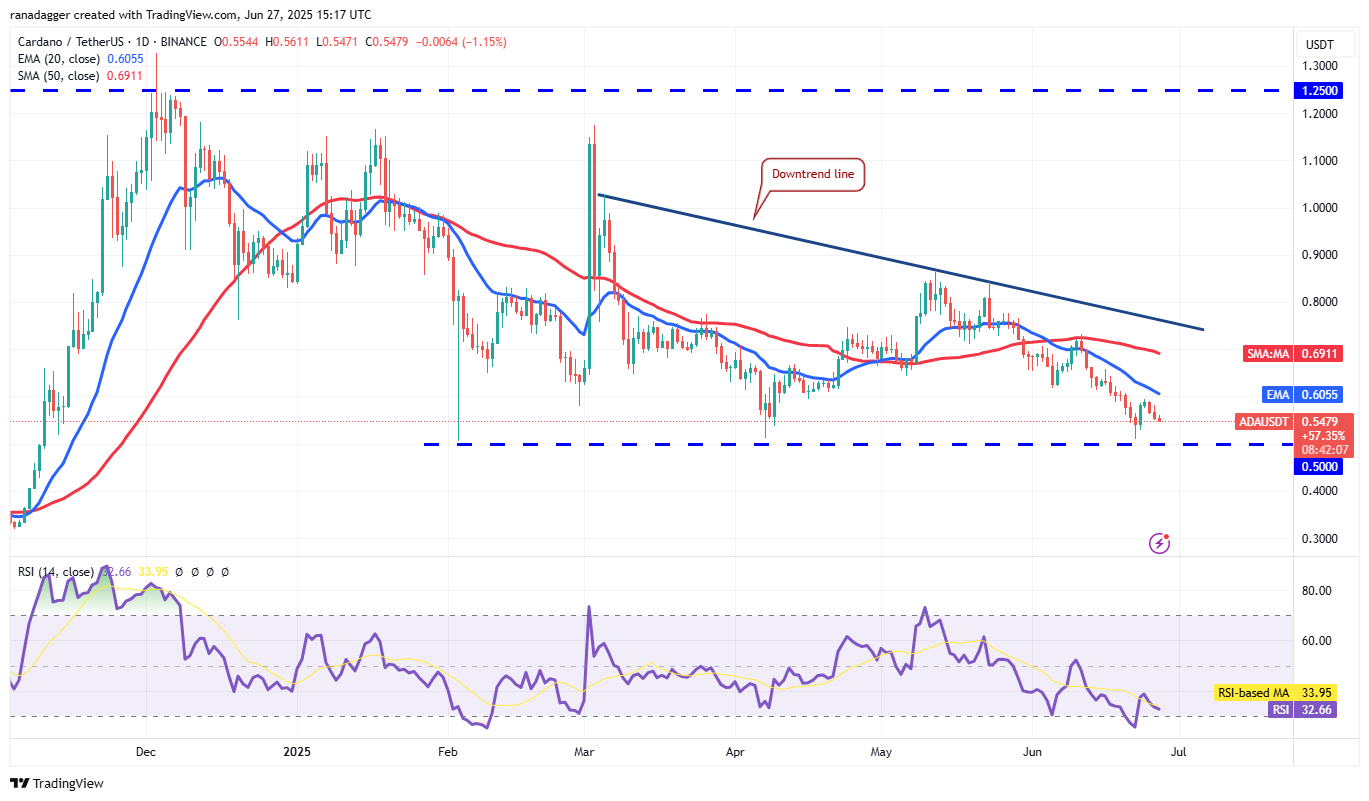
Sellers will try to pull the price below the $0.50 support, but the bulls are expected to mount a strong defense of the level. The first sign of strength will be a break and close above the 20-day EMA. The ADA/USDT pair may then climb to the 50-day SMA ($0.69) and later to the downtrend line.
Alternatively, a close below $0.50 will complete a bearish descending triangle pattern. The pair could then decline to $0.40.
Related: Three signs that XRP price will soon break out after 4-month consolidation
Hyperliquid price prediction
Hyperliquid (HYPE) is witnessing a tough battle between the bulls and the bears near the 20-day EMA ($36.93).
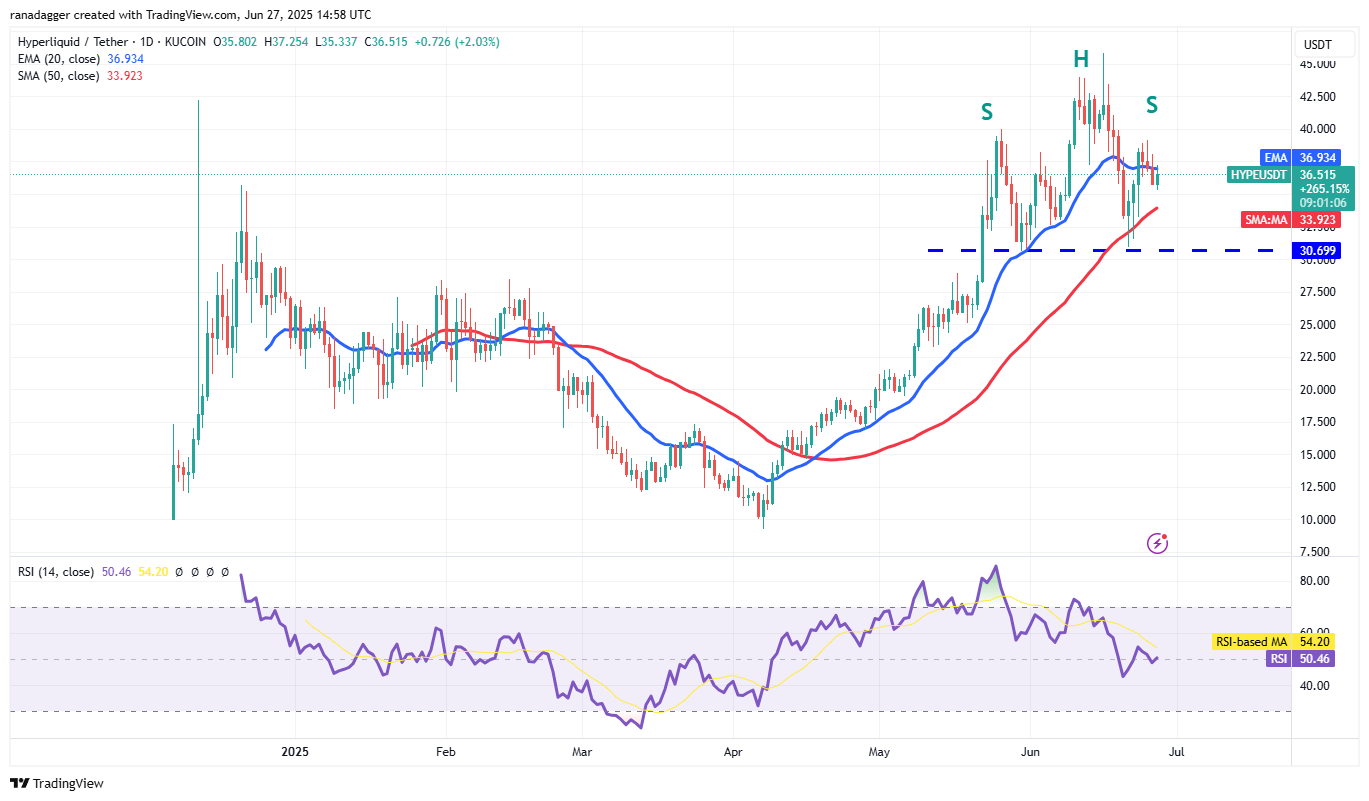
The flattish 20-day EMA and the RSI near the midpoint do not give a clear advantage either to the bulls or the bears. Buyers will have to drive the price above $39.12 to gain the upper hand. The HYPE/USDT pair could then climb to $45.80.
This positive view will be invalidated in the near term if the price turns down and breaks below the 50-day SMA ($33.92). The pair could then descend to the $30.69 support. Buyers are expected to defend the $30.69 level with all their might because a break below it will complete a bearish H&S pattern.
Bitcoin Cash price prediction
Bitcoin Cash (BCH) rose above the $500 resistance on Thursday, but the bulls could not sustain the higher levels.
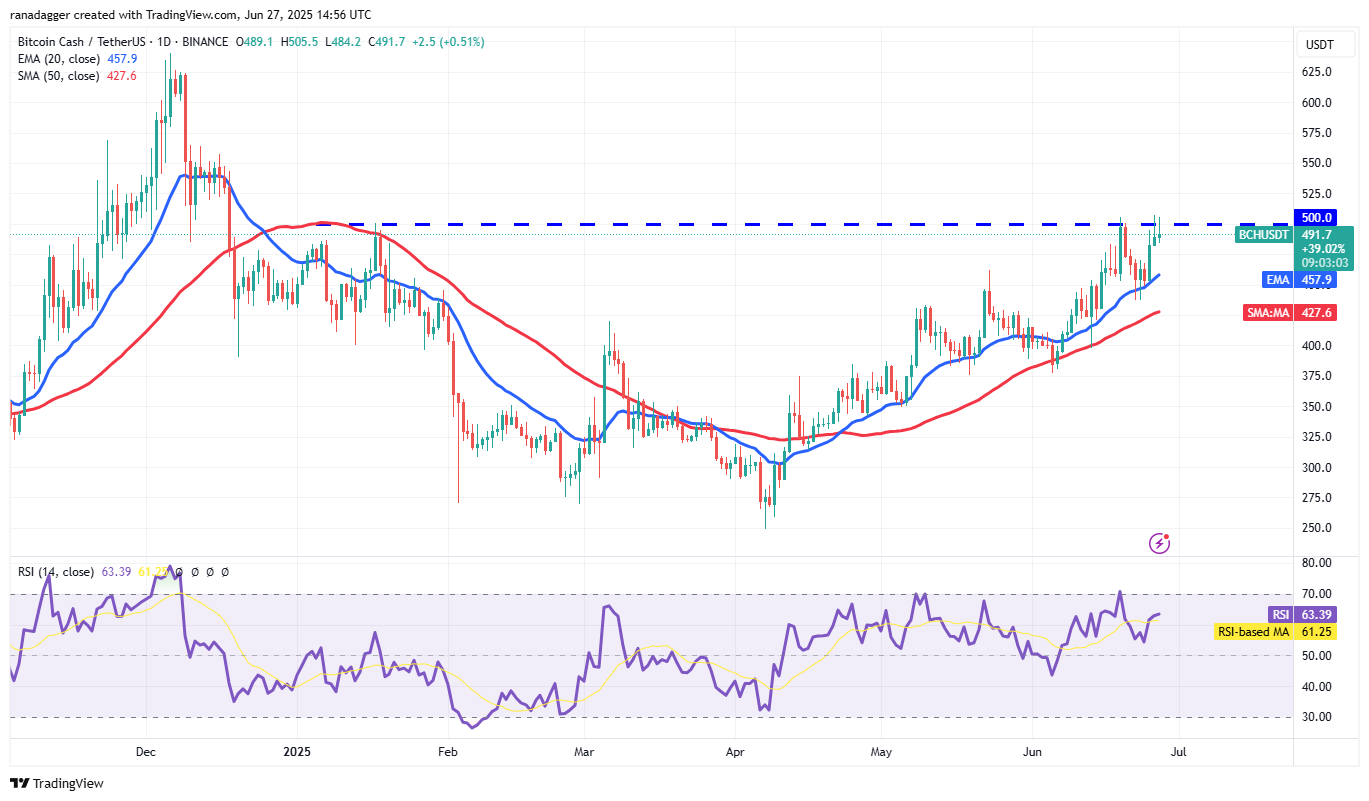
The repeated retest of a resistance level tends to weaken it. Buyers are again attempting to clear the $500 hurdle on Friday. If they manage to do that, the BCH/USDT pair could soar to $550.
Contrarily, if the price turns down sharply from $500, it suggests that the bears are aggressively defending the level. The pair could then pull back to the 20-day EMA ($457), likely attracting buyers.
Chainlink price prediction
Chainlink (LINK) has been facing resistance at the 20-day EMA ($13.24) since Tuesday, but a positive sign is that the bulls have not ceded much ground to the bears.
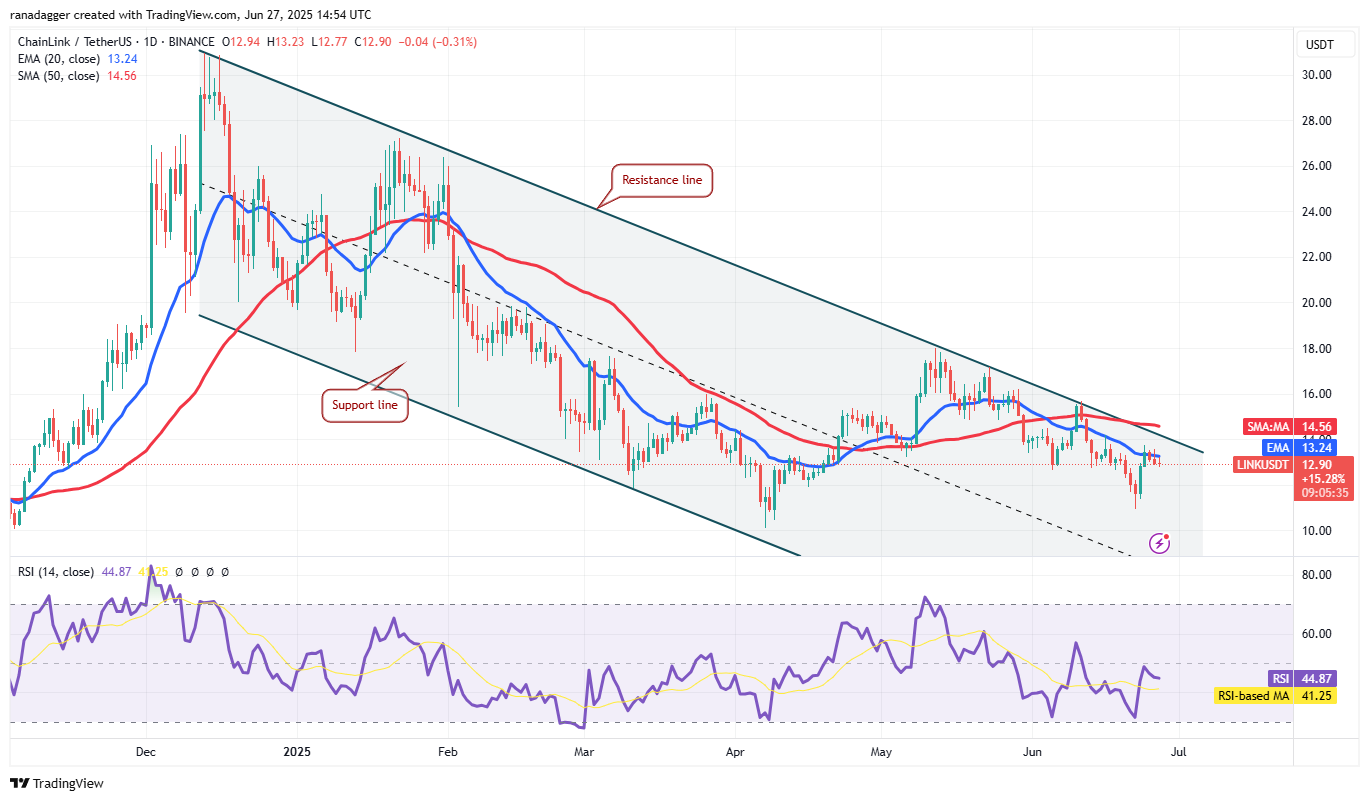
The bulls will try to challenge the resistance line, which is an important level to watch out for in the near term. If the price rises and maintains above the resistance line, it signals a potential trend change. The LINK/USDT pair could rally to $16 and later to $18.
On the upside, sellers will try to vigorously defend the zone between the 20-day EMA and the resistance line. If the price turns down sharply from the overhead zone, the pair could descend to $10.94.
This article does not contain investment advice or recommendations. Every investment and trading move involves risk, and readers should conduct their own research when making a decision.
Read the full article here


