


Bitcoin faces intensified selling pressure today, with a noticeable uptick in spot market outflows. This comes as markets grapple with the aftermath of Israel’s strike on Iran on Friday, sparking geopolitical uncertainty.
The coin is down 3% over the past 24 hours, and technical indicators point to waning buyer momentum. If the bearish pressure persists, BTC could slide further, potentially testing lower support levels in the days ahead.
Bitcoin Faces More Losses as Indicators Turn Red
Over the past 24 hours, BTC has declined by almost 5%, hovering around the $105,000 mark. The heightened risk-off sentiment is driving capital out of the spot market, signaling waning confidence among traders and institutional participants.
On the daily chart, BTC’s Relative Strength Index (RSI) has broken below the 50-neutral levels, confirming the rapidly declining buying momentum. As of this writing, this indicator is at 48.85, facing downward.
The RSI indicator measures an asset’s overbought and oversold market conditions. It ranges between 0 and 100, with values above 70 suggesting that the asset is overbought and due for a price decline. Converesly, values under 30 indicate that the asset is oversold and may witness a rebound.
BTC’s current RSI reading reflects the weakening bullish momentum and hints at the likelihood of further price dips in the near term.
Moreover, the setup of the coin’s Moving Average Convergence Divergence (MACD) supports this bearish outlook. As of this writing, BTC’s MACD line (blue) rests below its signal line (orange), a trend that indicates the dominance of sell-side pressure.

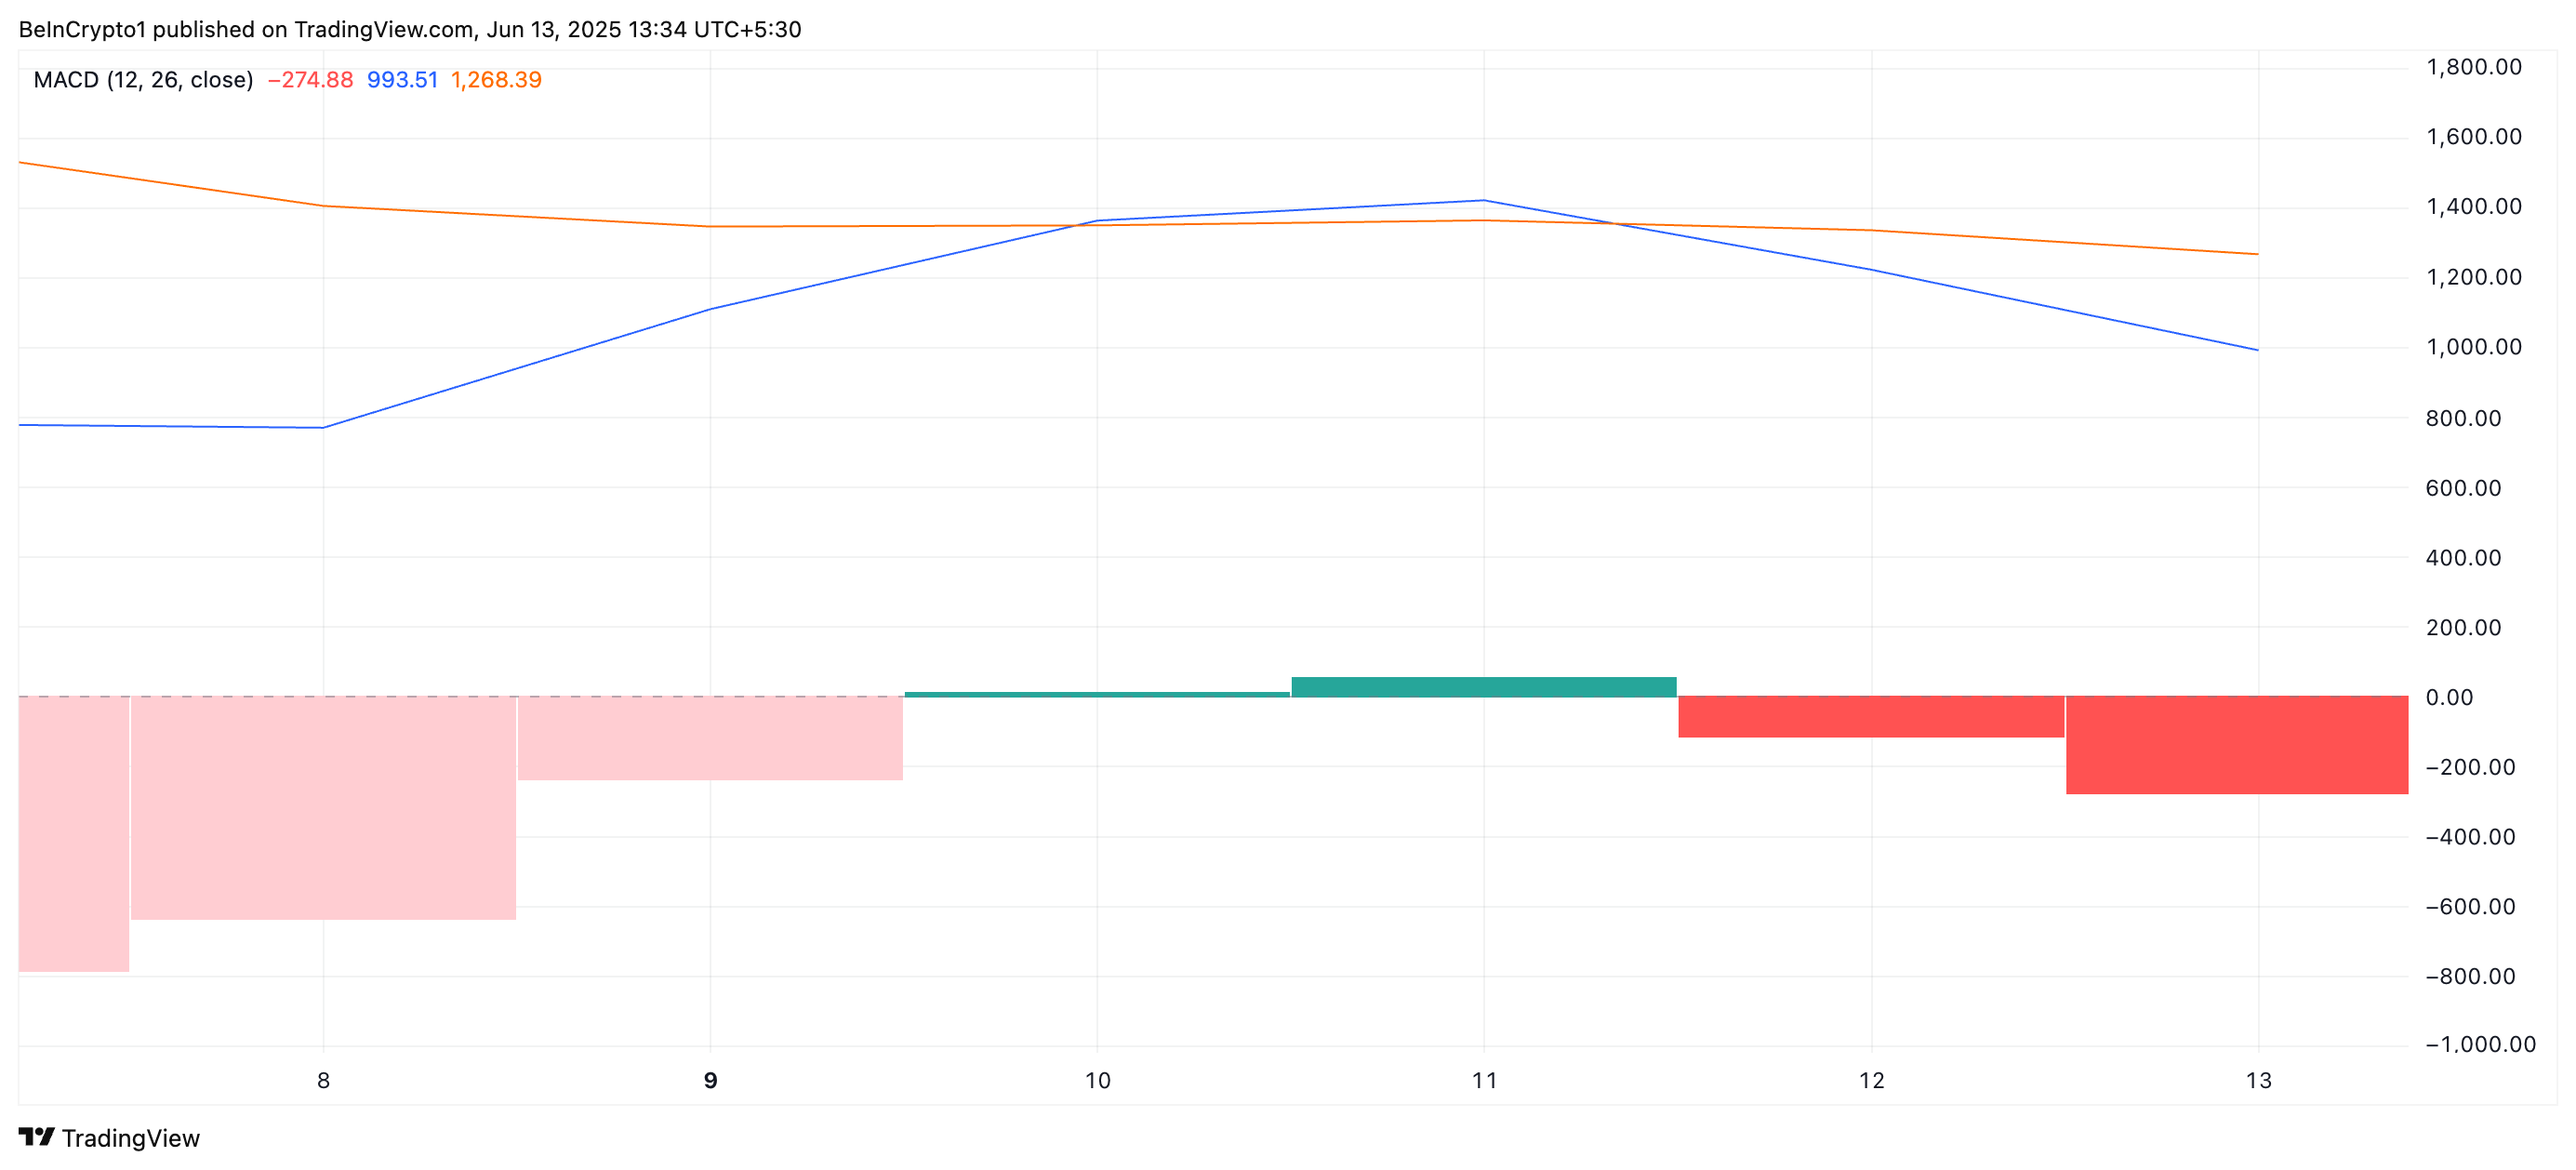
An asset’s MACD indicator identifies trends and momentum in its price movement. It helps traders spot potential buy or sell signals through crossovers between the MACD and signal lines. When set up this way, selling activity dominates the market, hinting at further price drops.
BTC Bears Tighten Grip as Price Slips
BTC currently trades at $105,304, marking its third consecutive red candle on the daily chart. With demand for the coin continuing to wane, it risks a drop toward the support floor at $103,061. If the bulls fail to defend this level, a deeper decline to $101,610 could occur.
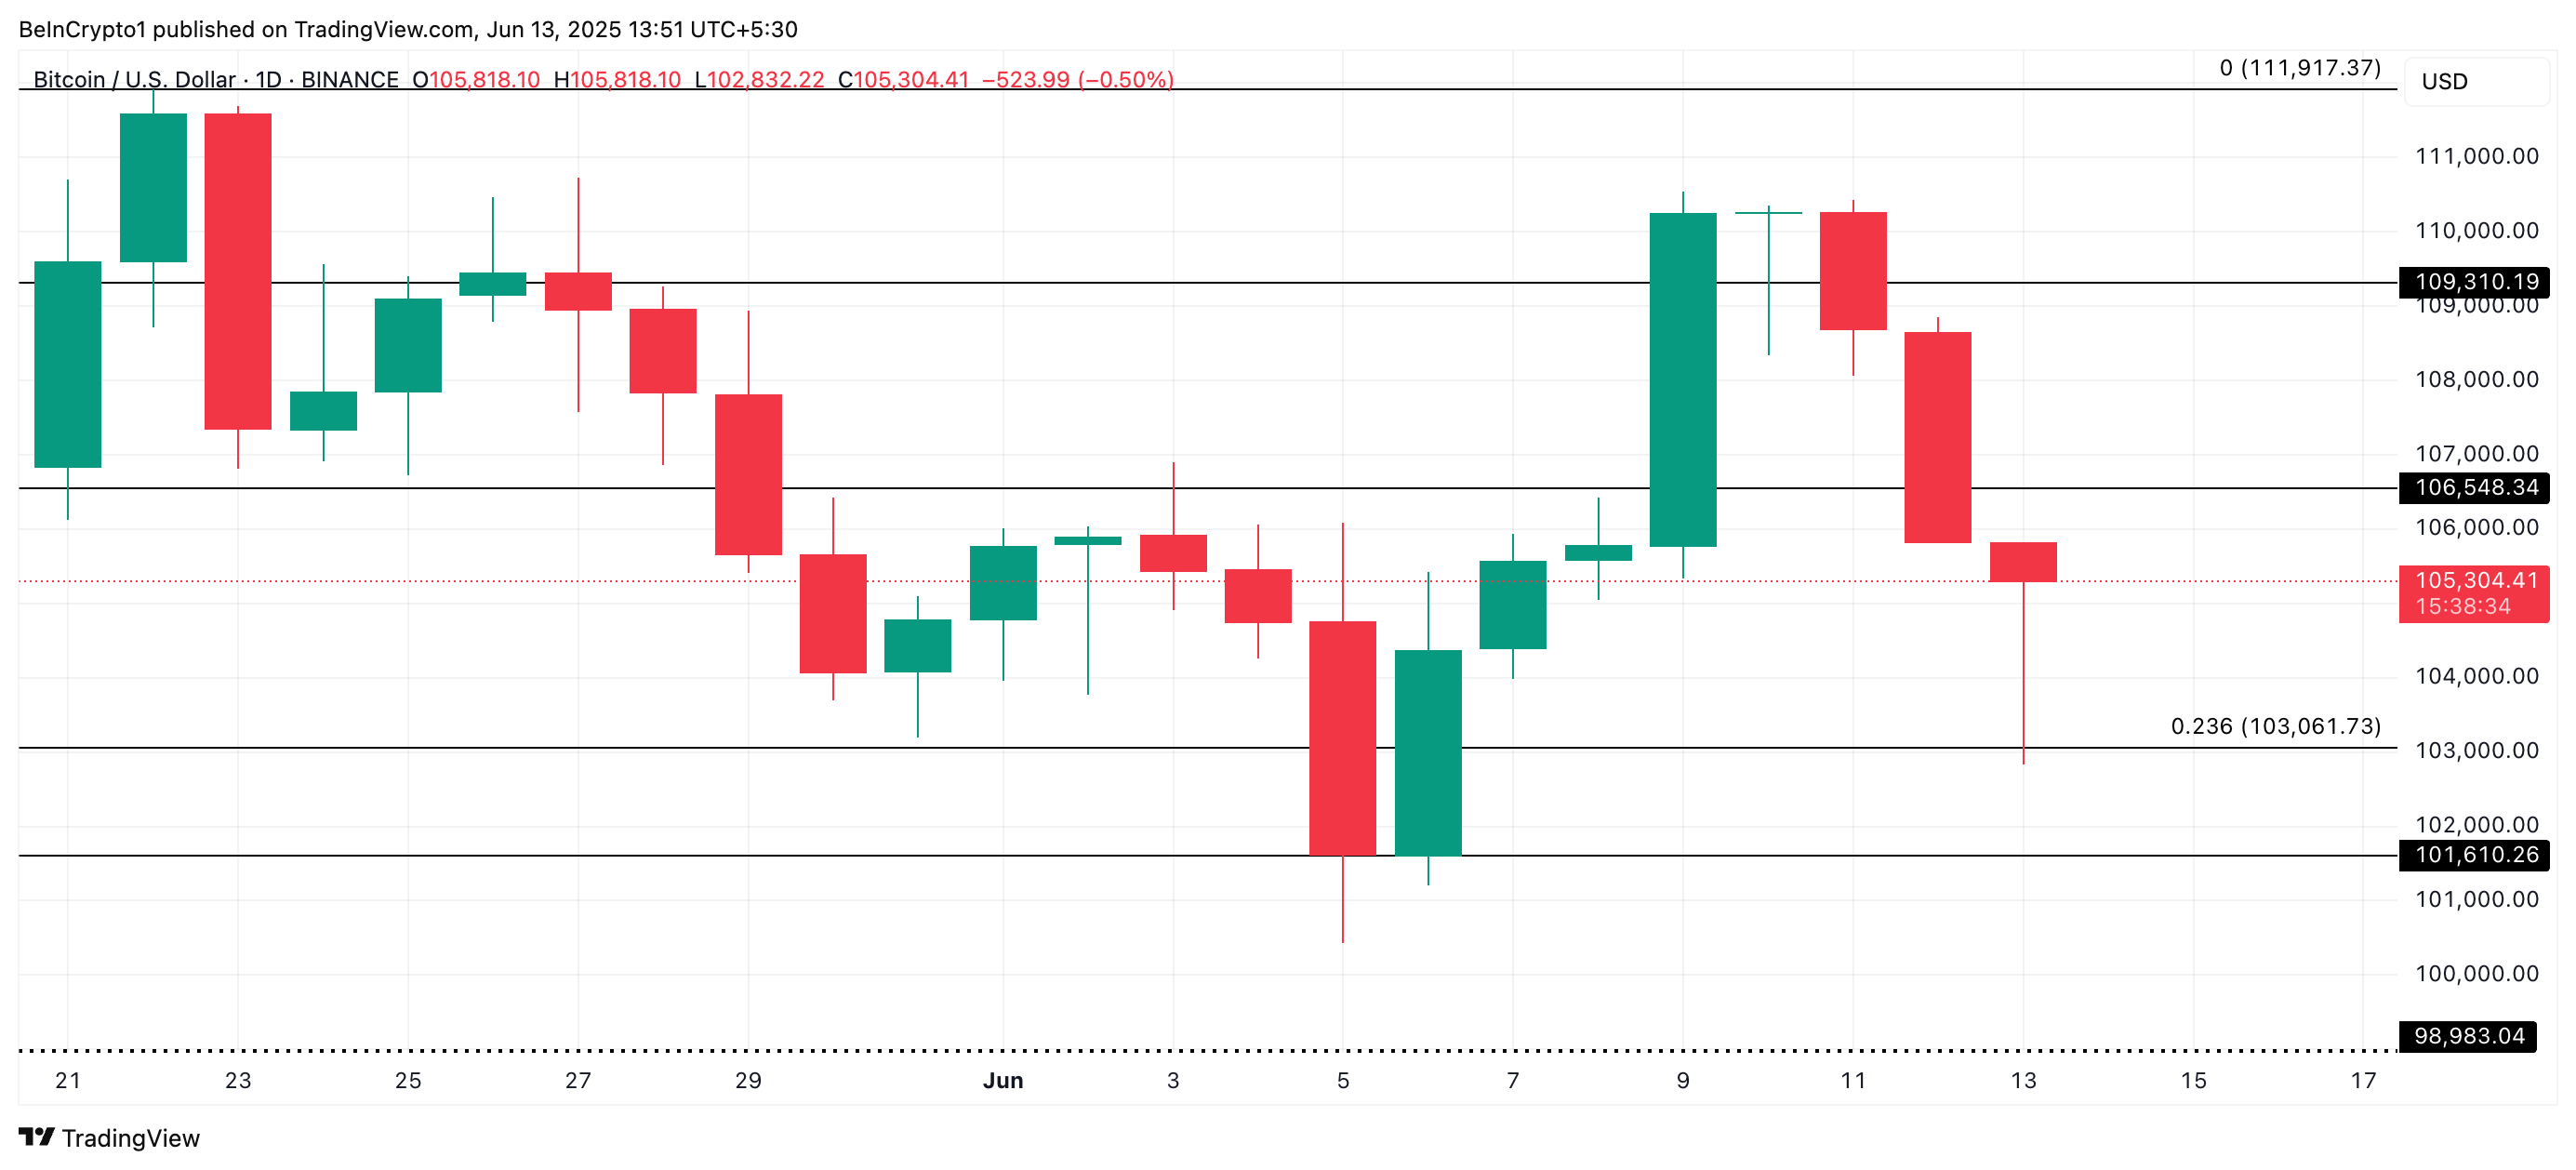
However, if new demand emerges, BTC may break out of its downtrend and rally toward the $106,548 resistance level.
Disclaimer
In line with the Trust Project guidelines, this price analysis article is for informational purposes only and should not be considered financial or investment advice. BeInCrypto is committed to accurate, unbiased reporting, but market conditions are subject to change without notice. Always conduct your own research and consult with a professional before making any financial decisions. Please note that our Terms and Conditions, Privacy Policy, and Disclaimers have been updated.
Read the full article here


