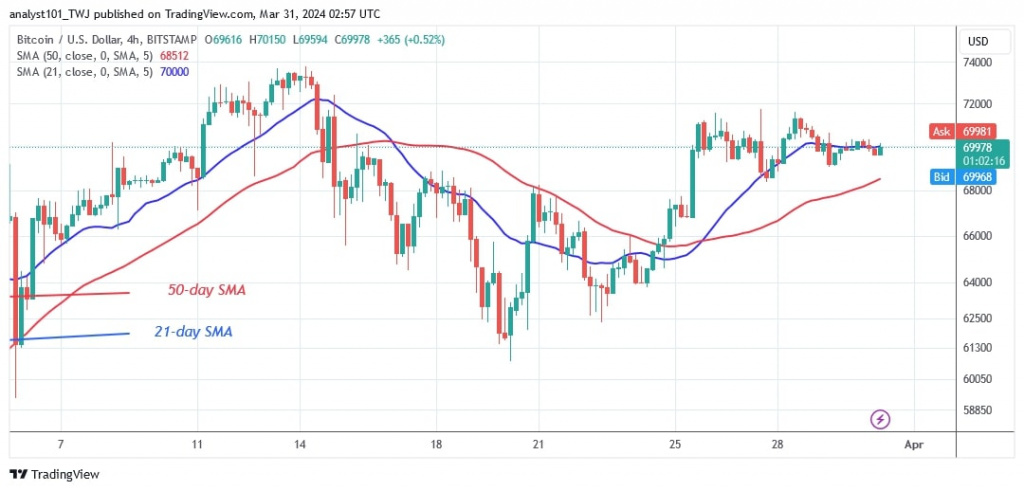
The price of Bitcoin (BTC) has remained stable after breaking above the 21-day SMA. Price analysis by Coinidil.com.
Long-term forecast for the Bitcoin price: bullish
On March 25, the Bitcoin price rallied, breaking above the 21-day SMA and reaching a high of $70,983. The largest cryptocurrency reached a new high and consolidated back above the psychological price of $70,000. The current price level was held by consolidation and the development of doji candlesticks. Currently, a price consolidation above the moving average lines may lead to a price recovery or a breakdown.
On the upside, if Bitcoin rises above the $70,000 support, it will rise above the $73,666 resistance. The uptrend will continue to the high of $80,000. Nonetheless, Bitcoin will continue to trade above the 21-day SMA but below the $73,666 barrier, from which the price has been unable to recover.
Bitcoin indicator reading
Bitcoin is consolidating after a rally above the 21-day SMA. The major cryptocurrency will rise as long as the price bars are above the moving average lines. The increasing frequency of doji candlesticks delays the price movement. Doji candlesticks indicate traders’ indifference to market direction.
Technical indicators:
Key resistance levels – $70,000 and $80,000
Key support levels – $50,000 and $40,000
What is the next direction for BTC/USD?
Bitcoin is above the moving average lines, but the price has remained stable due to the formation of doji candlesticks. On the 4-hour chart, BTC is trading above the moving average lines but in a sideways trend below the $72,000 mark.

Disclaimer. This analysis and forecast are the personal opinions of the author and are not a recommendation to buy or sell cryptocurrency and should not be viewed as an endorsement by CoinIdol.com. Readers should do their research before investing in funds.
Read the full article here

