Brett (BRETT/USDT) is in a moderate bullish trend with a current trading price of $0.09413 up by 1.38%. Technical indicators are showing potential bullish moves.
BRETT: Current Price Action and Trend
The price is within the proximity of the 20-day Simple Moving Average SMA of $0.09367. Acting as a support level, this SMA suggests that buyers are probing this level as they try to drive the price up.
1-day BRETT trading chart|source TradingView
The upper Bollinger Band at $0.11212 is a crucial resistance level, and if Brett gets to this level it may experience selling pressure that may hinder further upward moves.
Moreover, breaking above this resistance level could mean that there is strong bullish momentum, while failure to pull through may lead to further consolidation around the SMA level.
RSI Shows Moderate Bullish momentum
Meanwhile, the RSI stands at 52.01, indicating a slight bullish momentum but not quite in the overbought territory. This level shows that there is potential for further gain.
If the RSI rises further towards 60 it could signal a rise in Brett demand and a growing bullish trend. A cross over the 70 mark could push the price to the overbought region, which is likely to cause a price correction.
Analyst View: Key Levels to Watch in Brett Chart
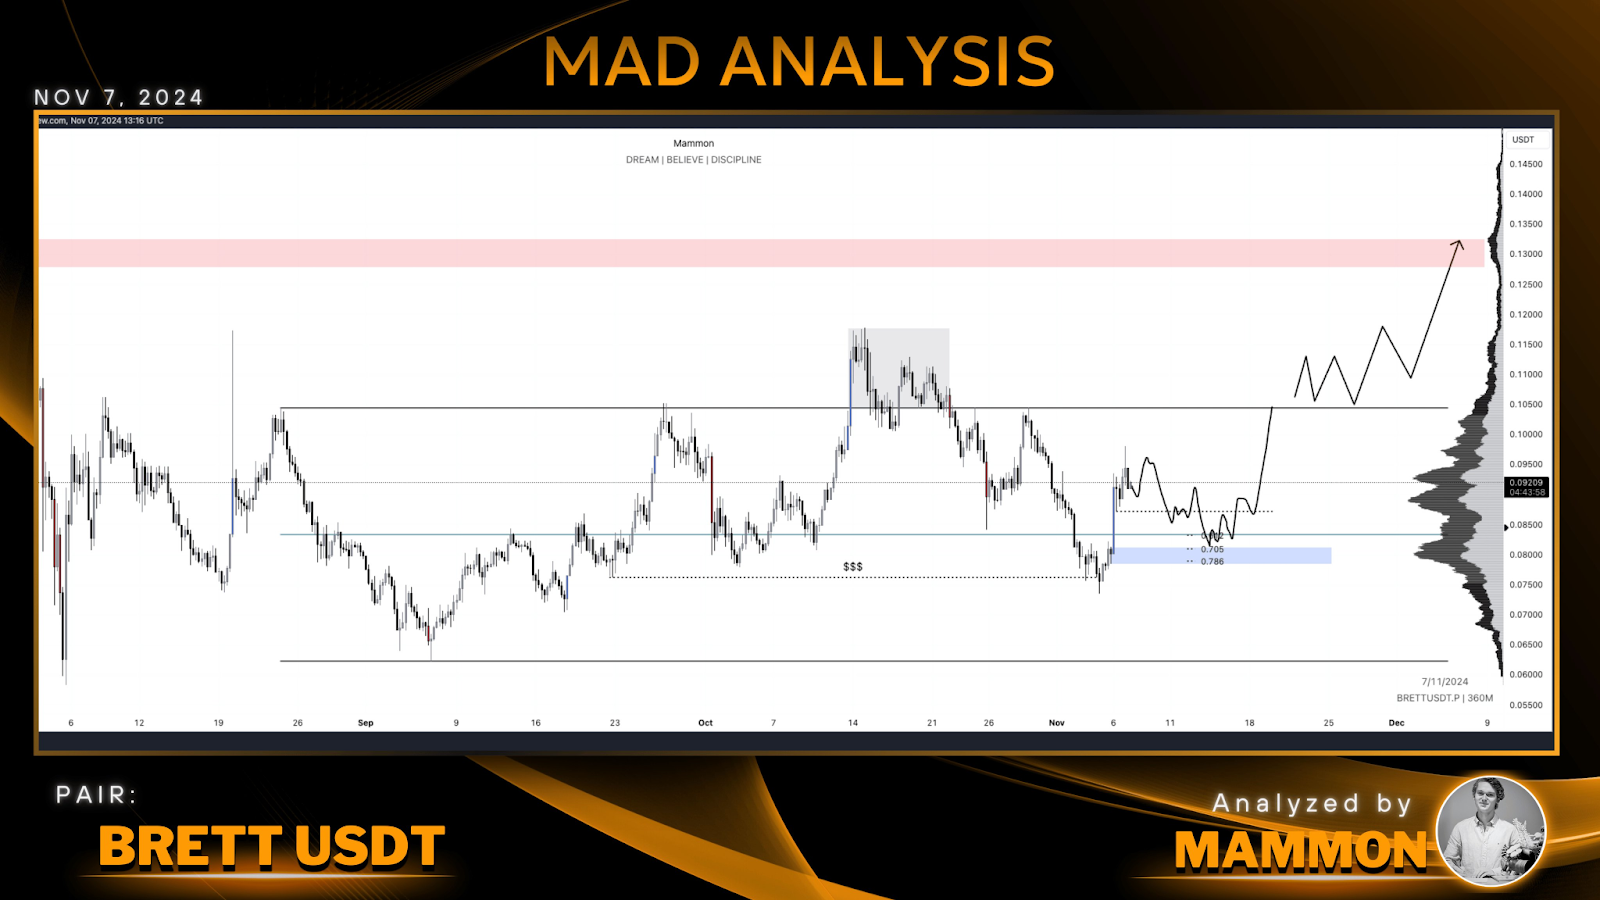
One analyst M_A_DTrading, identifies an area of importance in the price chart. According to the analyst chart, the price lies at a crucial point after a sharp upward, creating an off-set that could pull in more demand.
$BRETT is gaining traction on our timeline as a potential leading memecoin on Base, especially with ecosystem support from Coinbase, which could drive significant growth. The chart is in a pivotal zone after a strong upward bounce, leaving a notable imbalance. However, with price… pic.twitter.com/YvP3vMeSzJ
— 𝗠 𝗔 𝗗. 𝗧𝗿𝗮𝗱𝗶𝗻𝗴 (@M_A_DTrading) November 7, 2024
The recent dip in Brett from higher levels indicates that bulls must hold the present higher low to avoid further pullbacks.

source:X
The resistance levels of $0.105 and $0.13 can be regarded as a breakout zone. A move above this level could lead to a strong bullish trend if supported by more interest from the Base network, which had been supporting Brett as a growing meme coin.
A breakdown from this level may signal a bearish reversal threatening the memecoin to experience substantial retracement to the lower support levels
Potential for Long-Term Gains
Another analyst views Brett as a promising opportunity amid market dips. With a pro-crypto government and support from the Base network, they are optimistic about the future.
You simply can’t lose when your holding $BRETT. The market dips due to election fears, lets you buy more $BRETT at a cheaper price, and comes back stronger. 💪It’s free money if you capitalize on this.
Understand $BRETT isn’t going anywhere but up.📈 $BRETT is the first to… pic.twitter.com/XiFzjPidC0
— Justin (@XParadose) November 7, 2024
Brett recently recovered 30% from a market dip, underscoring its resilience and potential for further gains. As the mascot of the Base chain, Brett has garnered attention and support, strengthening its standing in the market.
The analyst argues that market dips are buying opportunities, especially as Brett’s affiliation with Base fosters long-term growth. This positive sentiment aligns with its recent price action, reflecting strong interest and potential for higher valuations as demand for Brett increases.
Read the full article here

