Bears are in control of today’s market session as seen from the drop in the global market cap after yesterday’s bull market. The total cap stood at $2.59T as of press time, representing a 0.33% drop over the last 24 hours, while the trading volume stood at 94.96B in the same period, at a 20.8% decrease in the previous 24 hours.
Bitcoin Price Review
Bitcoin (BTC) faces corrections in today’s session, as seen from its price movements. Looking at the Bollinger Bands, we see that the Bitcoin price recently touched the upper band, suggesting potential resistance.
On the other hand, the Woodies CCI indicator is in negative territory, which might indicate a possible downward price momentum. As of press time, the Bitcoin price stood at $68,015, a 2.80% decrease in valuation over the last 24 hours.
4-hour BTC/USD Chart | Source: TradingView
Ethereum Price Review
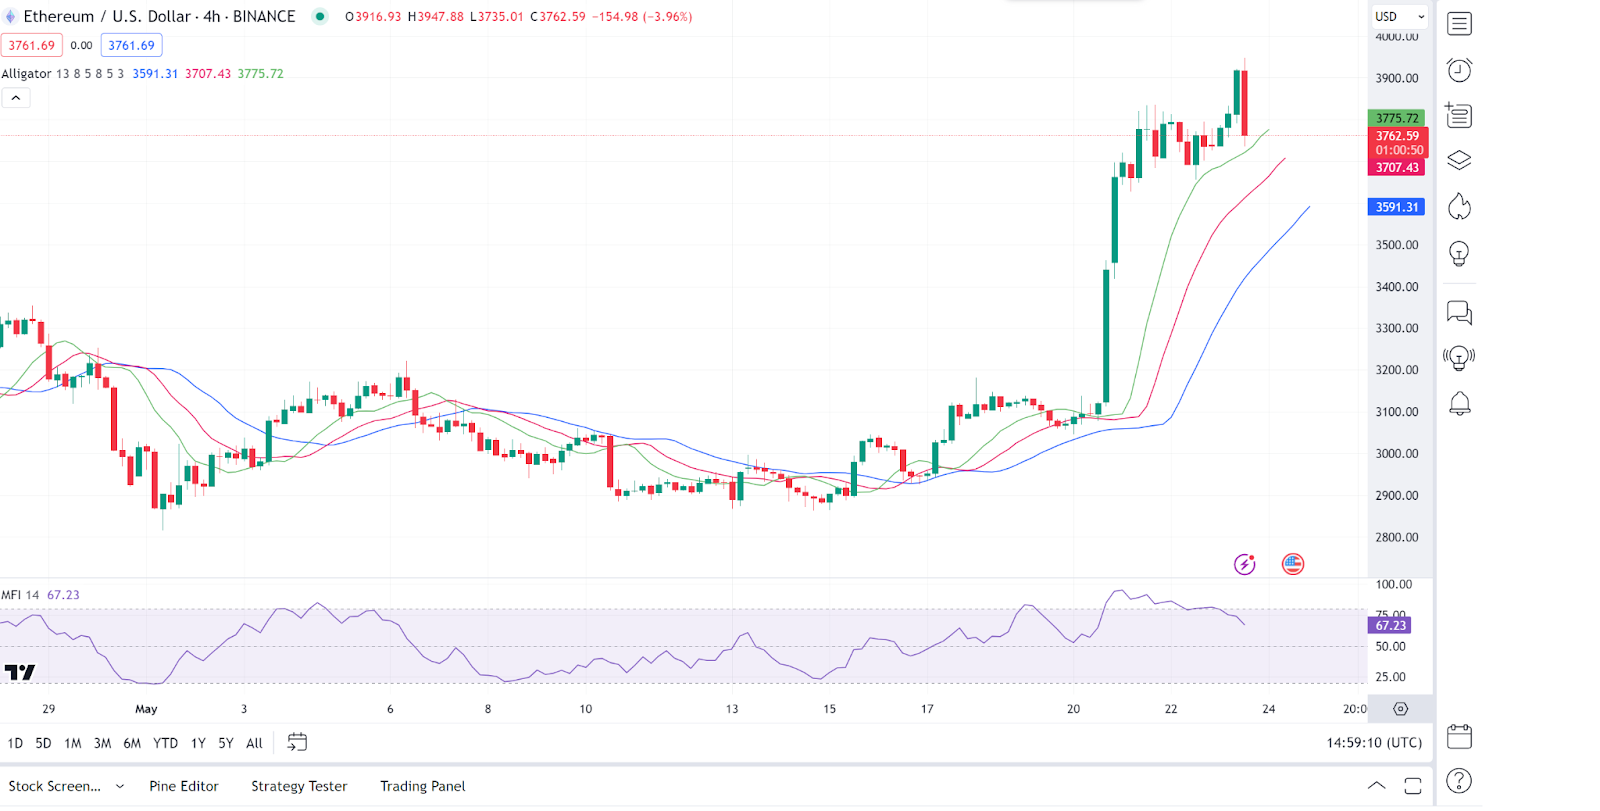
Ethereum (ETH) is also among the gainers in today’s session, as seen from its price increase. An in-depth analysis shows that Williams Alligator Indicator lines are well-spaced and trending upwards, indicating a strong bullish phase.
On the other hand, the MFI (Money Flow Index) is currently high, suggesting buying interest is strong but approaching overbought levels. As of press time, the Ethereum price stood at $3,791, a 1.77% increase in valuation over the last 24 hours.

4-hour ETH/USD Chart | Source: TradingView
Ripple Price Review
Ripple (XRP) is also another gainer in today’s session. The Ripple price is above the super trend as it displays bullish prospects. However, the recent red candle stick patterns could suggest some bear actions on the token.
On the other hand, the Awesome Oscillator indicates a weak bullish momentum as the bars are above the zero line but decreasing in height. As of press time, the Ripple price stood at $0.5342, a 0.08% increase in valuation over the last 24 hours.
4-hour XRP/USDT Chart | Source: TradingView
NEAR Protocol Price Review
NEAR Protocol is also among the gainers in today’s session, as evidenced by its price movements. Looking at an in-path analysis, we see mixed signals from the cloud lines suggesting indecision in the market.
On the other hand, looking at the volume oscillator, we notice low volume variability, which indicates a lack of strong buying or selling interest. As of press time, the Ripple price stood at $7.64, a 3.12% increase in valuation over the last 24 hours.
4-hour NEAR/USDT Chart | Source: TradingView
Avalanche Price Review
However, Avalanche (AVAX) is facing corrections in today’s session, as seen from its price increase. Looking at in-depth analysis, we see that the Auto Pitchfork indicates potential support and resistance levels, with the Avalanche price near the median line which might act as support.
On the other hand, we see that the ADX (Average Directional Index) shows a decrease in trend strength as it dips, which could indicate the current trend is weakening. As of press time, the Avalanche price stood at $38.4, a 4.28% decrease in valuation over the last 24 hours.
4-hour AVAX/USDT Chart | Source: TradingView
Read the full article here

