Bears are losing their grip on the markets as several coins show signs of recovery. Despite this, the global market cap has dropped to $2.25T as of press time, representing a 1.8% drop over the last 24 hours. Meanwhile, the trading volume was $99.8B, representing an 11.5% increase in the previous 24 hours.
Bitcoin Price Review
Bitcoin (BTC) is having a good session. It has managed to gather some gains after recent consolidations. Analysing Bitcoin charts, we notice the price moving within the Bollinger Bands with the latest candles positioned above the 20 SMA, indicating potential upward momentum. The green candlesticks indicate that the Bitcoin price is recovering from a recent sell-off. The Awesome Oscillator is below zero, which traditionally shows bearish momentum, but the reducing size of the red histogram bars could be signaling a slowing down of the downward momentum.
The 20 SMA is currently acting as support. Still, a definitive trend can only be established if the price moves more decisively above the SMA or the bands tighten, which often precedes a period of high volatility. As of press time, the Bitcoin price stood at $63,245, representing a 4.28% increase from its previous 24-hour price.
4-hour BTC/USD Chart | Source: TradingView
Injective Price Review
Injective (INJ) was among the top gainers in today’s session, managing some notable gains. Analysing Injective price charts, we notice the SuperTrend indicator has turned from bearish to bullish, as indicated by the change from red to green, suggesting the potential beginning of an uptrend.
On the other hand, the Woodies CCI is hovering around the zero line, which may indicate a potential change in trend or consolidation. As of press time, the Injective price stood at $27.8, representing a 7.3% increase from its previous 24-hour price.
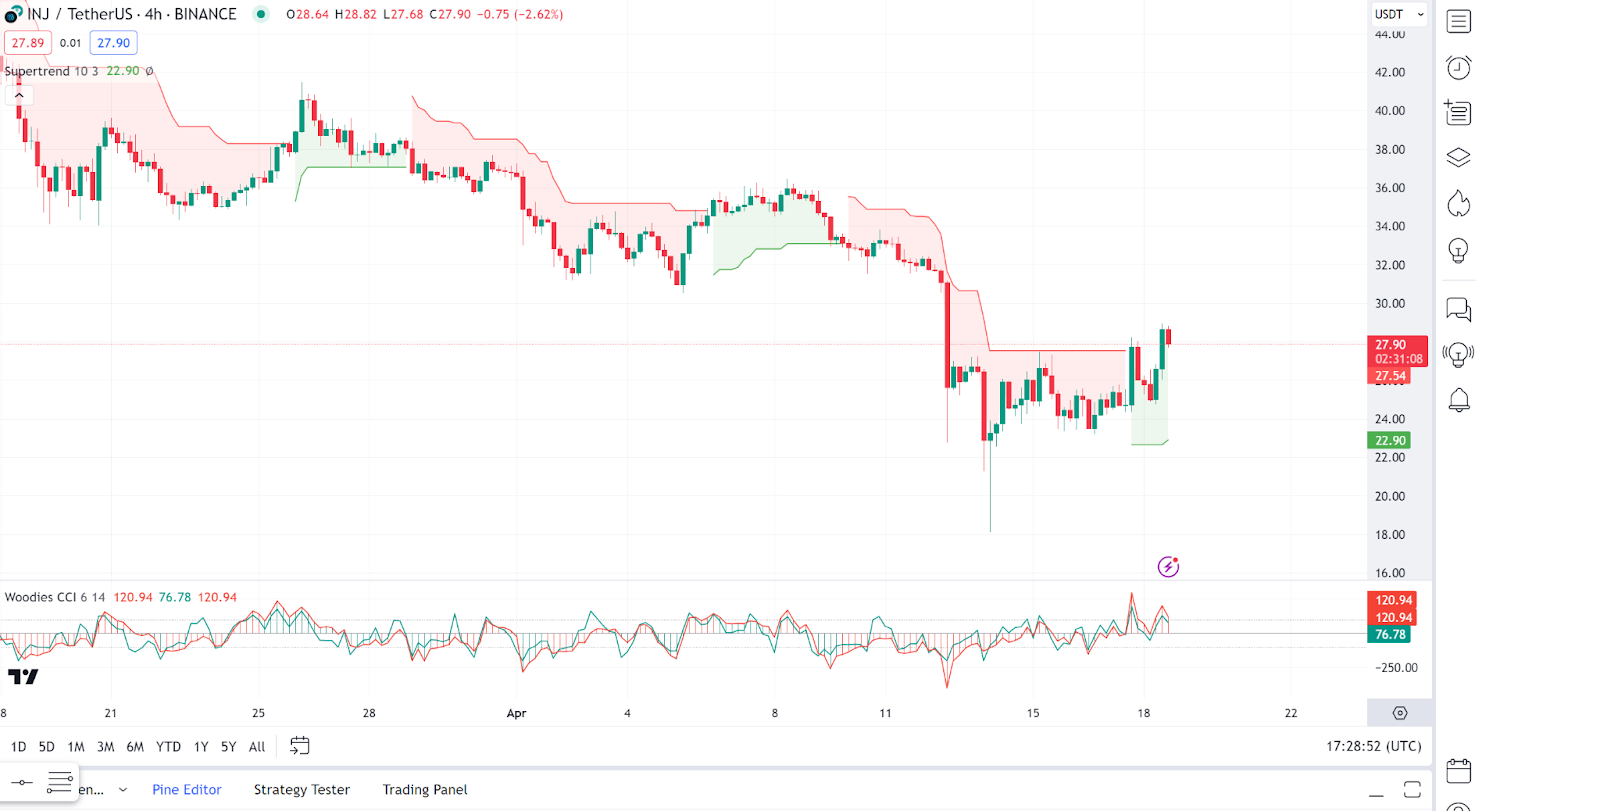
4-hour INJ/USDT Chart | Source: TradingView
Celestia Price Review
However, Celestia (TIA) has failed to appear among the gainers today and has failed to post gains in today’s session. INJ charts show a significant downtrend and a sharp recovery in the latest candlesticks.
The SuperTrend indicator has turned from bearish to bullish, as indicated by the change from red to green, suggesting the potential beginning of an uptrend. As of press time, the Celestia price stood at $9.99, representing a 5.7% increase from its previous 24-hour price.
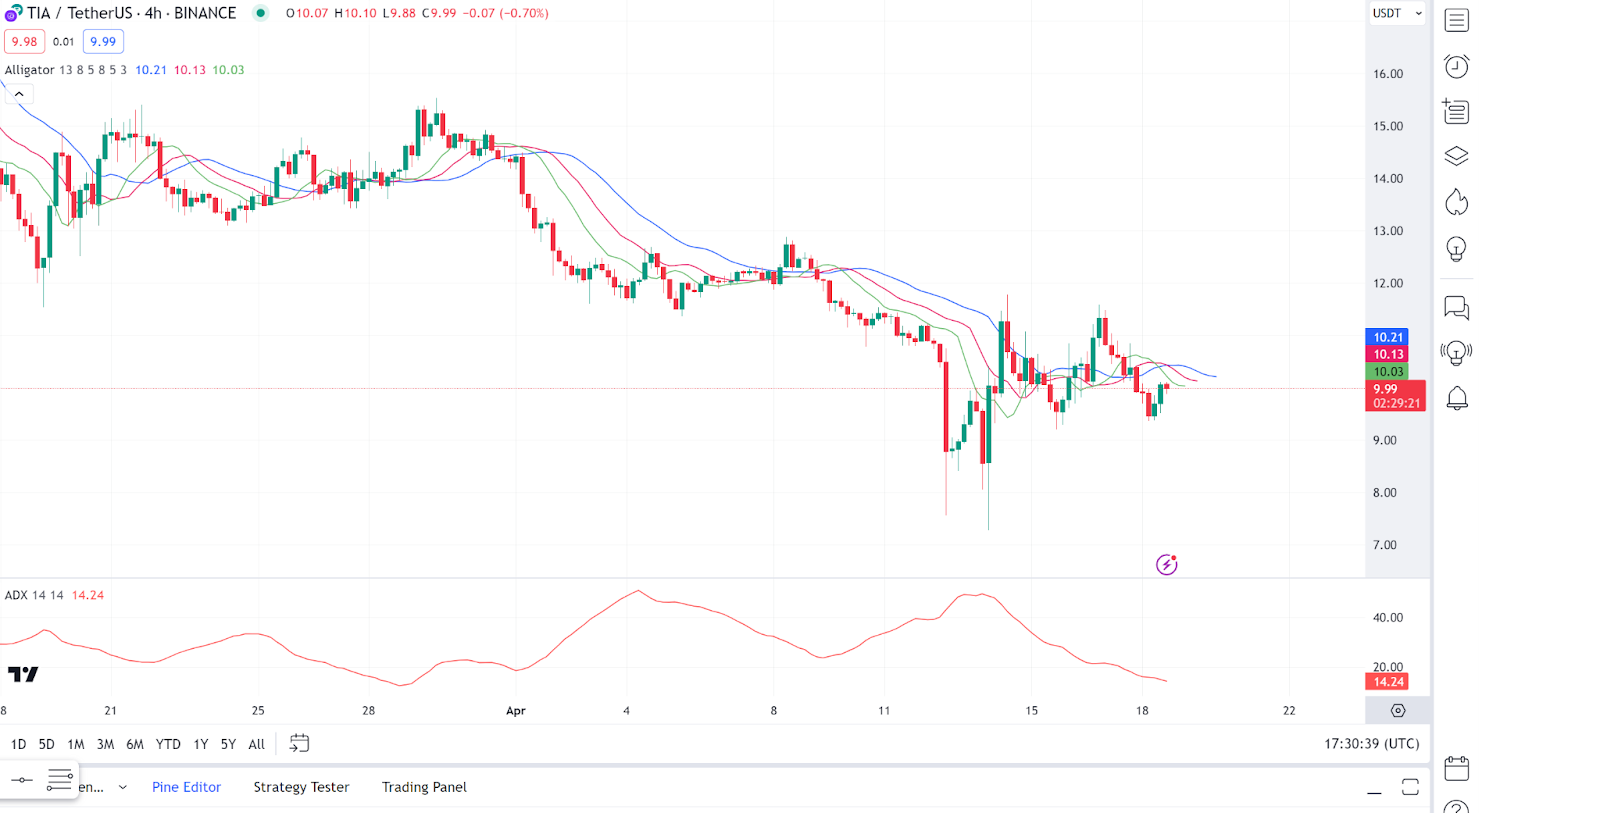
4-hour TIA/USDT Chart | Source: TradingView
Cat In A Dogs World Price Review
Despite its explosive introduction into space, cat In A Dogs World (MEW) has yet to post gains despite the recoveries. The chart presents a volatile sideways movement with no clear trend direction. The Ichimoku Cloud is mixed; the price is within the cloud, suggesting indecision or consolidation in the market.
On the other hand, the Volume Oscillator is below zero and has decreased, indicating lower trading volumes during the consolidation phase. As of press time, the Cat In A Dogs World price stood at $0.004978, representing a 12.9% decrease from its previous 24-hour price.
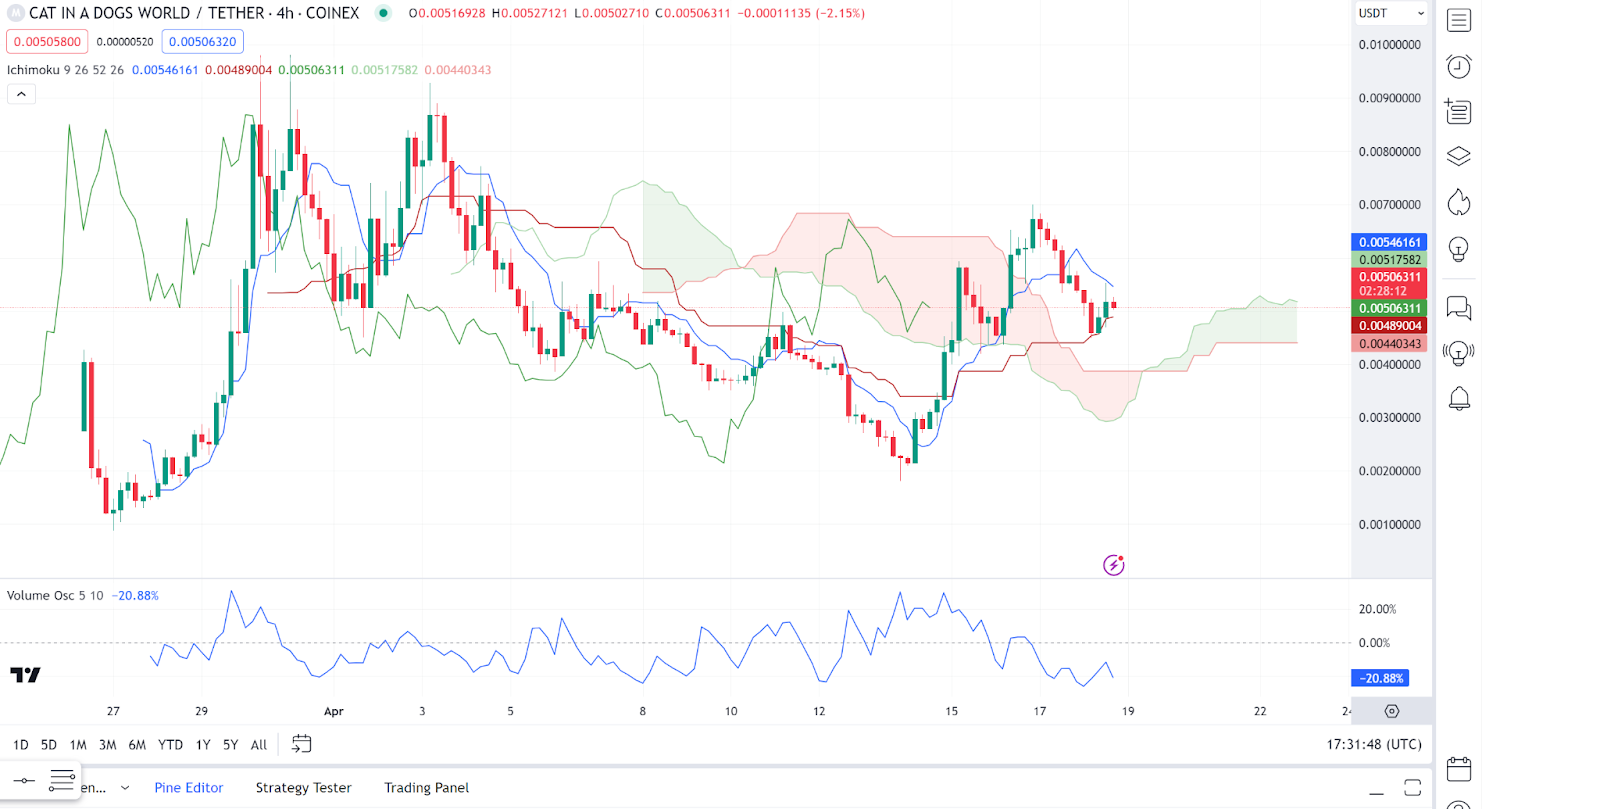
4-hour MEW/USDT Chart | Source: TradingView
Omni Network Price Review
Omni Network (OMNI) also faced correction in today’s session, as it failed to post gains. After an in-depth analysis, the chart shows a short-term ascending channel pattern, suggesting a temporary bullish bias within this timeframe.
On the other hand, the Stoch RSI is in the middle range, indicating neither overbought nor oversold conditions, but trending towards overbought. During writing, the Omni Network price stood at $24.76, representing a 23.6% decrease from its previous 24-hour price.
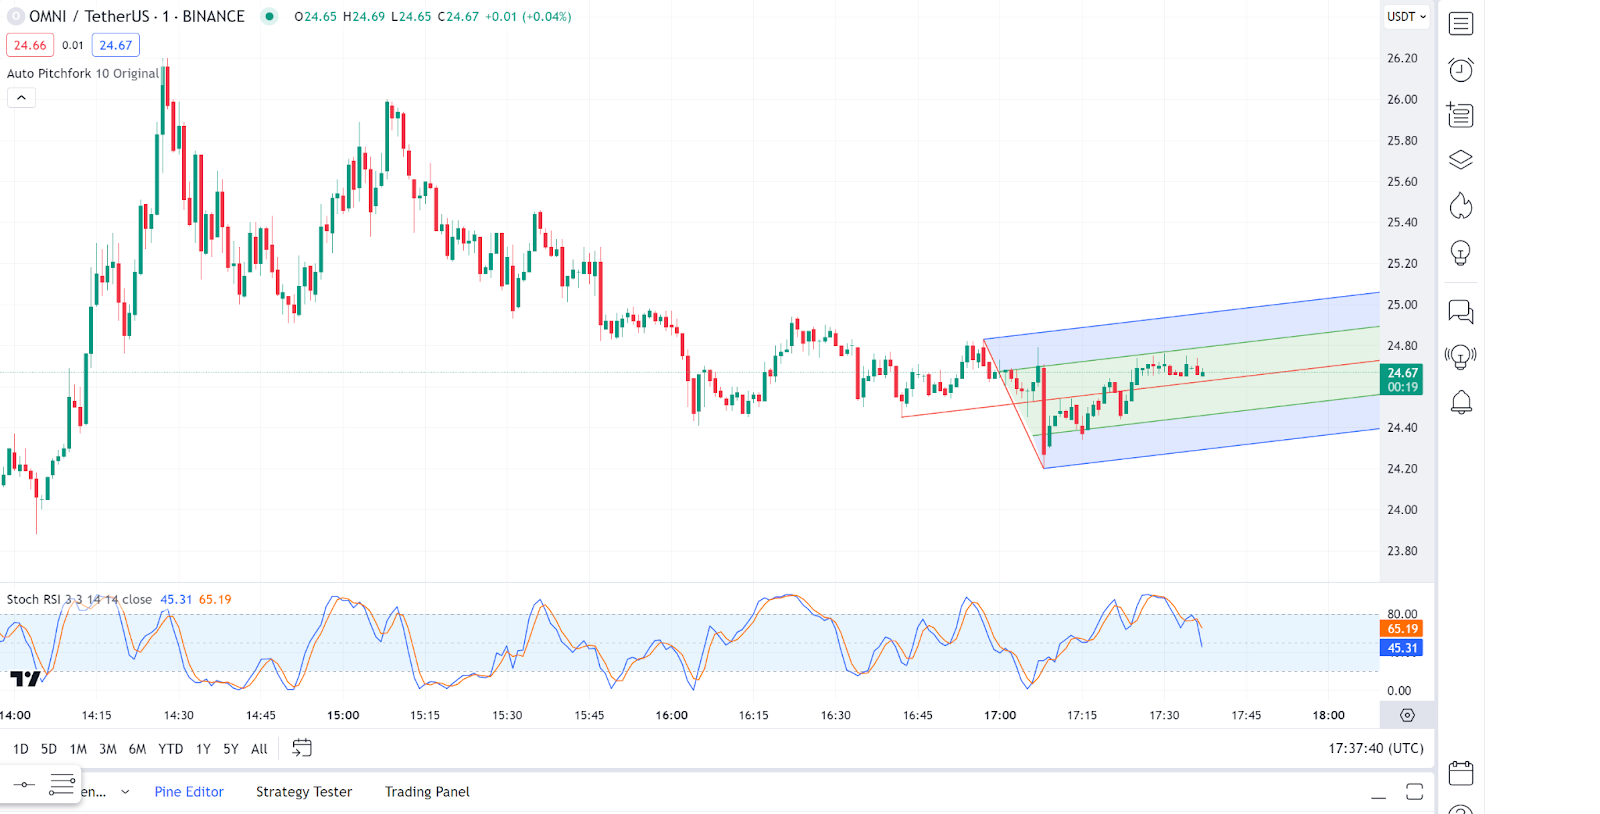
4-hour OMNI/USDT Chart | Source: TradingView
Read the full article here


