- Bitcoin trades above $72,000 on Wednesday, eyeing its all-time high in the short term.
- Ethereum price finds support at the ascending trendline, suggesting a possible rally ahead.
- Ripple price finds support around the $0.488 level; a firm close below would suggest a continuation of its downtrend.
Bitcoin (BTC) is trading above $72,000 on Wednesday after successfully retesting its key support level, setting its sights on an all-time high in the short term. Ethereum (ETH) has similarly found support around a crucial level, indicating a potential rally ahead. However, Ripple (XRP) recovered slightly after retesting its key support level; a close below this level could continue its ongoing decline.
Bitcoin setting its sights on an all-time high
Bitcoin price found support at around $66,000 on Friday and rose 9% until Tuesday, reaching a daily high of $73,620. At the time of writing on Wednesday, it trades slightly down around $72,300.
If BTC maintains its upward momentum, it may soon rally to retest its next key barrier of $73,777, the all-time high reached in mid-March. A successful close above this level could pave the way for BTC to target the 141.40% Fibonacci extension level (drawn from July’s high of $70,079 to August’s low of $49,072) at $78,777.
The Relative Strength Index (RSI) trades at its overbought level of 70, showing strong bullish momentum. However, traders will be advised not to add to their long positions as the chances of a price pullback would increase. Another option is that the rally continues, and the RSI climbs further up into overbought and remains there.
BTC/USDT daily chart
If BTC falls closes below $66,000, it could decline a further 5.8% to retest its next support at $62,055, the 61.8% Fibonacci retracement level (drawn from July’s high of $70,079 to August’s low of $49,072).
Ethereum price is poised for a rally after finding support around its ascending trendline
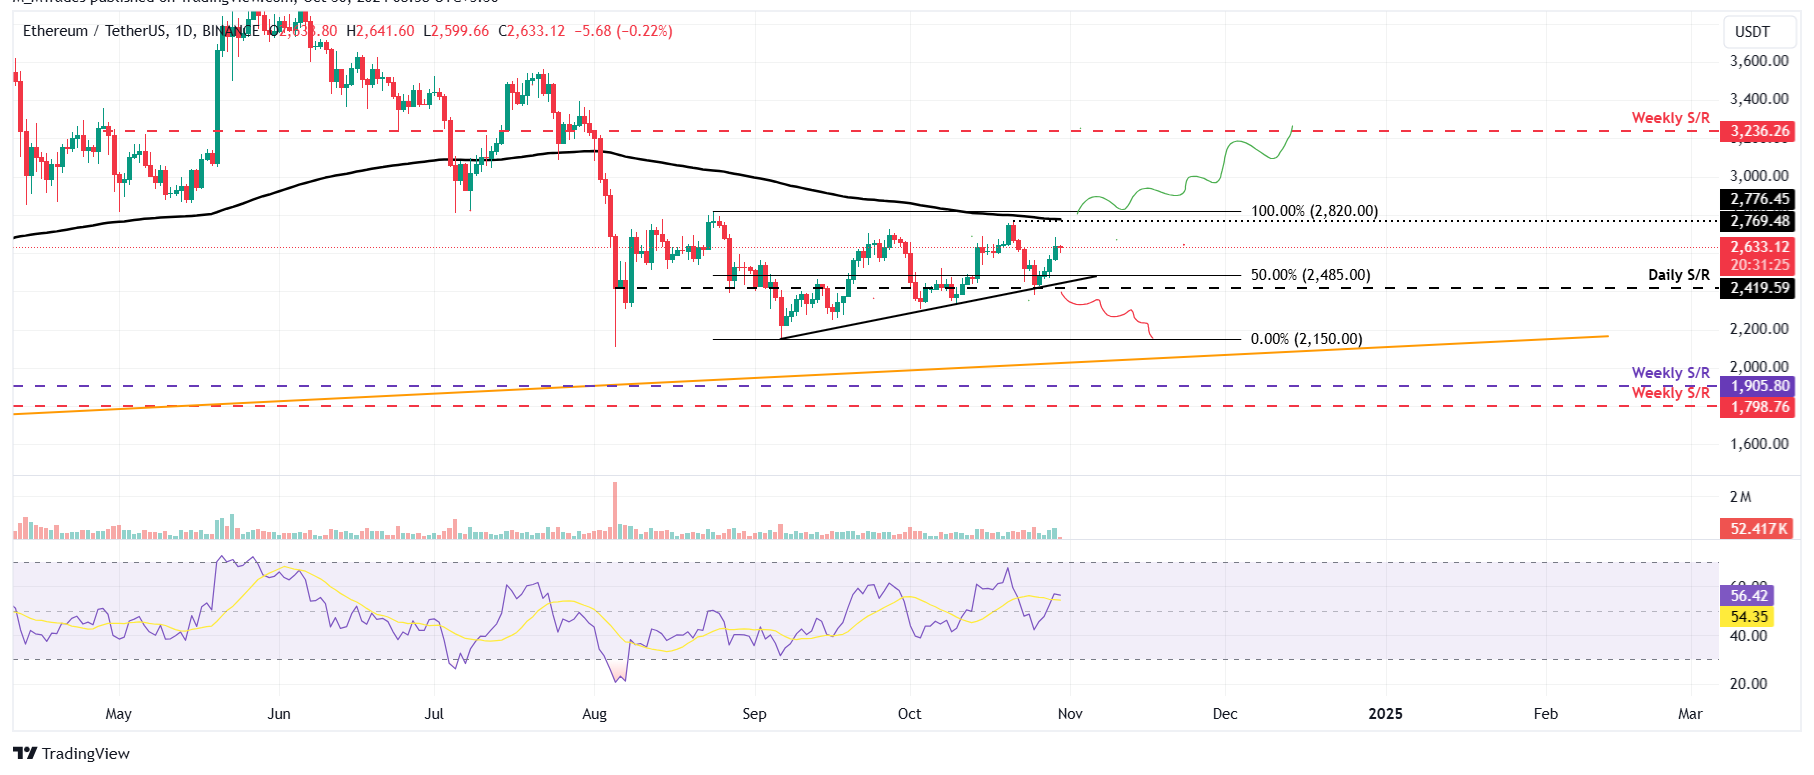
Ethereum price found support at the ascending trendline (drawn from joining multiple low levels with a trendline since early September) on Friday and rallied 8.59% until Tuesday. As of Wednesday, it continues to trade higher, around $2,630.
If the ascending trendline continues to hold as support, ETH could rally to its current level to retest its 200-day EMA at $2,769. A successful close above $2,820 would extend an additional 15% rally to retest its next weekly resistance at $3,236.
The RSI on the daily chart reads at 56, above its neutral level of 50, indicating increasing bullish momentum.

ETH/USDT daily chart
Conversely, if ETH breaks and closes below the ascending trendline around $2,419, it could extend the decline by 11% to retest its September 6 low of $2,150.
Ripple price is poised for a downtrend if it closes below $0.488
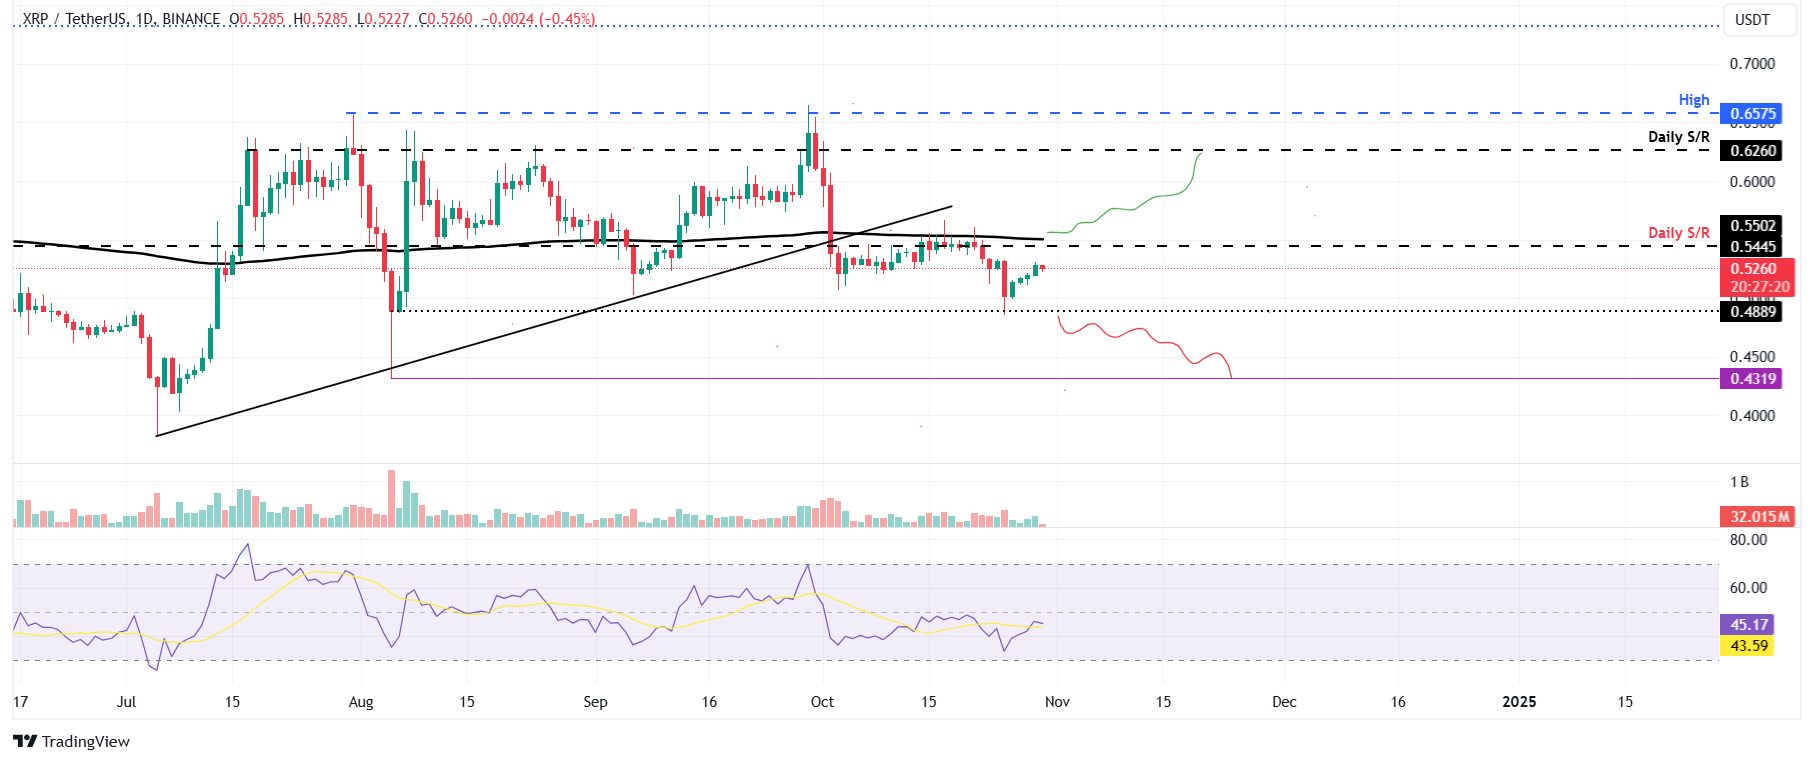
Ripple price faced resistance from its 200-day EMA at the $0.550 level on October 21 and declined 8.3% until Friday. It retested its August 6 low of $0.488 and recovered 5.22% until Tuesday. At the time of writing on Wednesday, it trades slightly lower, around $0.526.
If XRP continues its decline and closes below $0.488, it could extend the decline by 12% to retest its August 5 low of $0.431.
The RSI indicator on the daily chart is at 45, below its neutral level of 50, suggesting that bearish momentum is gaining traction.

XRP/USDT daily chart
If XRP continues to recover, break and close above the 200-day EMA at $0.550, it could extend the rally by 13% to retest its next daily resistance level at $0.626.
Read the full article here


