


Ethereum price today is holding near $2,755 after a volatile session on June 12, where bulls briefly reclaimed the $2,800 level before fading slightly into consolidation. While short-term momentum has cooled, the broader trend structure remains bullish as price holds above key moving averages and reclaims important breakout levels from earlier this month.
What’s Happening With Ethereum’s Price?
ETH price dynamics (Source: TradingView)
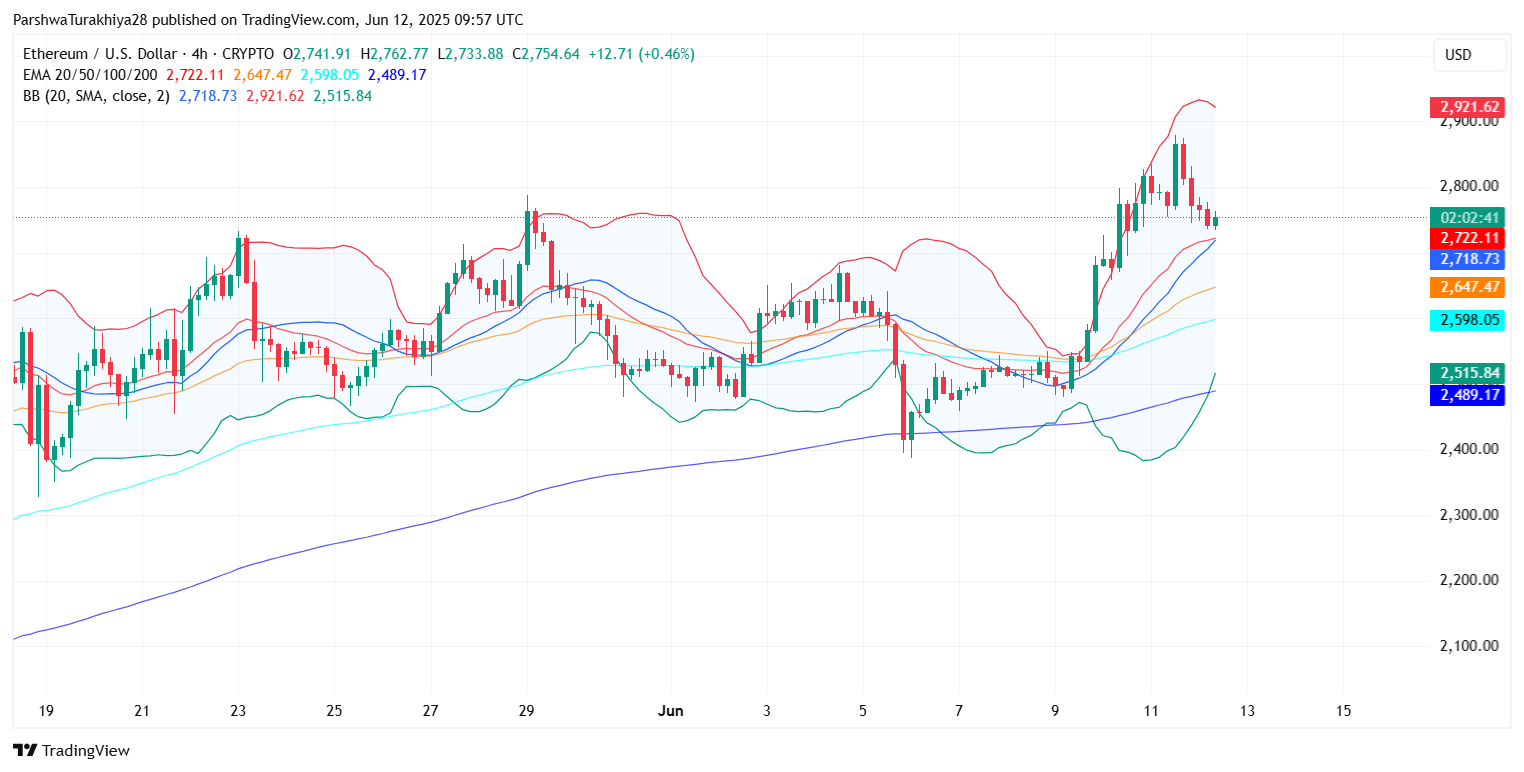
The 4-hour chart shows that Ethereum price action has successfully broken out of a multi-week descending wedge and is now consolidating above the $2,700 demand block. This zone, previously a key resistance, has flipped into support after the bullish impulse on June 10. The trendline breakout aligns with a clean retest of the $2,515–$2,545 base structure, which was confirmed by a surge in volume and wide candle bodies.

ETH price dynamics (Source: TradingView)
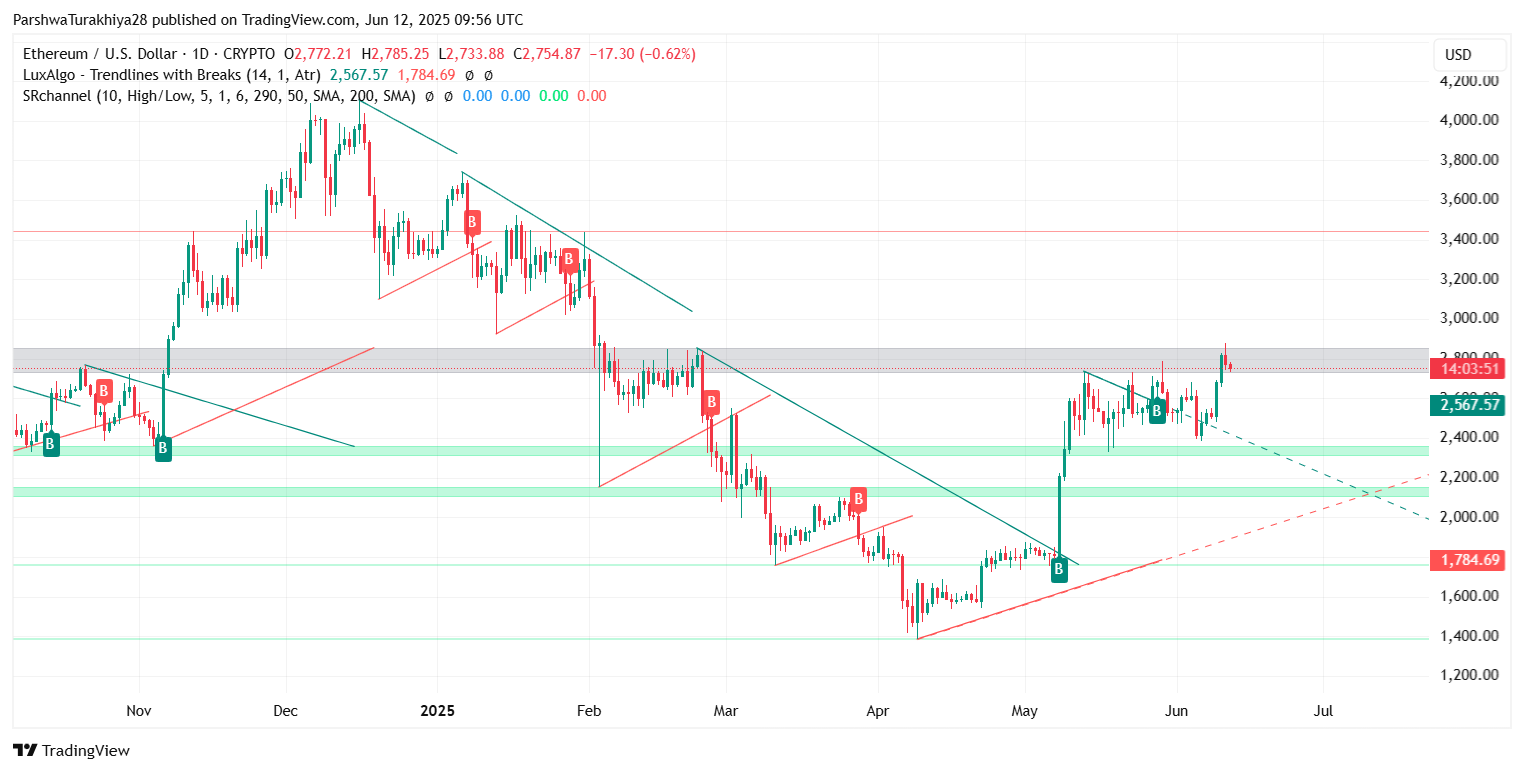
On the daily chart, price is testing the upper boundary of a long-term resistance band near $2,780–$2,800. A decisive daily close above this region would mark a higher-high continuation pattern, possibly targeting $2,920 and $3,065 next. However, failure to break through convincingly could lead to another retest of the $2,600–$2,645 support shelf.
Indicators Show Mixed Signals As Price Cools
ETH price dynamics (Source: TradingView)
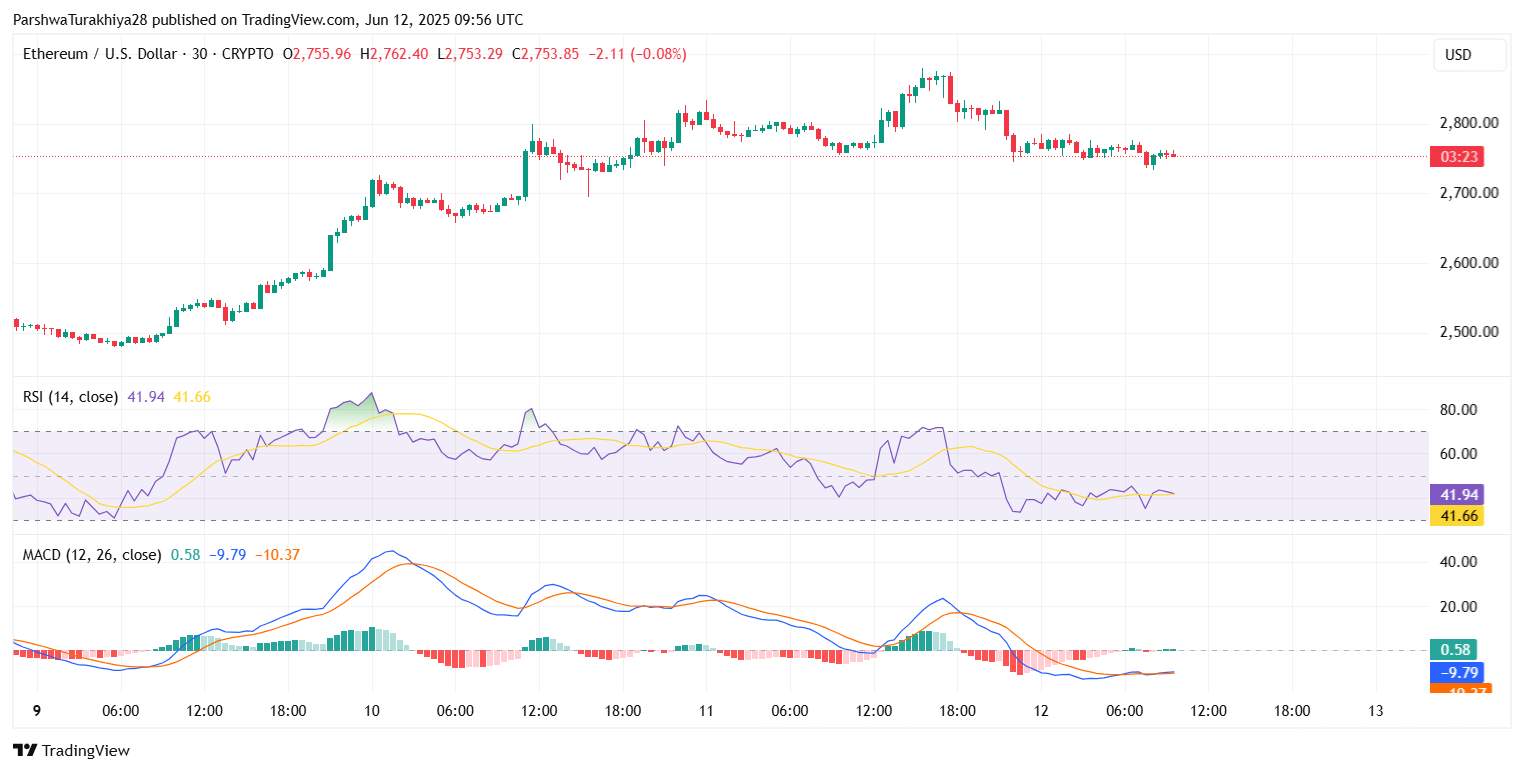
Momentum indicators are signaling caution in the short term. The 30-minute Relative Strength Index (RSI) has retraced to 41.94, hovering just above the oversold boundary. This suggests that Ethereum price volatility is decreasing, and a potential bounce may occur if the $2,720–$2,740 micro-support holds.
On the MACD, the histogram has flattened and the signal line has crossed below, indicating short-term bearish divergence. The indicator currently reads -9.79 on the histogram, reflecting waning bullish momentum since the high near $2,875.
ETH price dynamics (Source: TradingView)
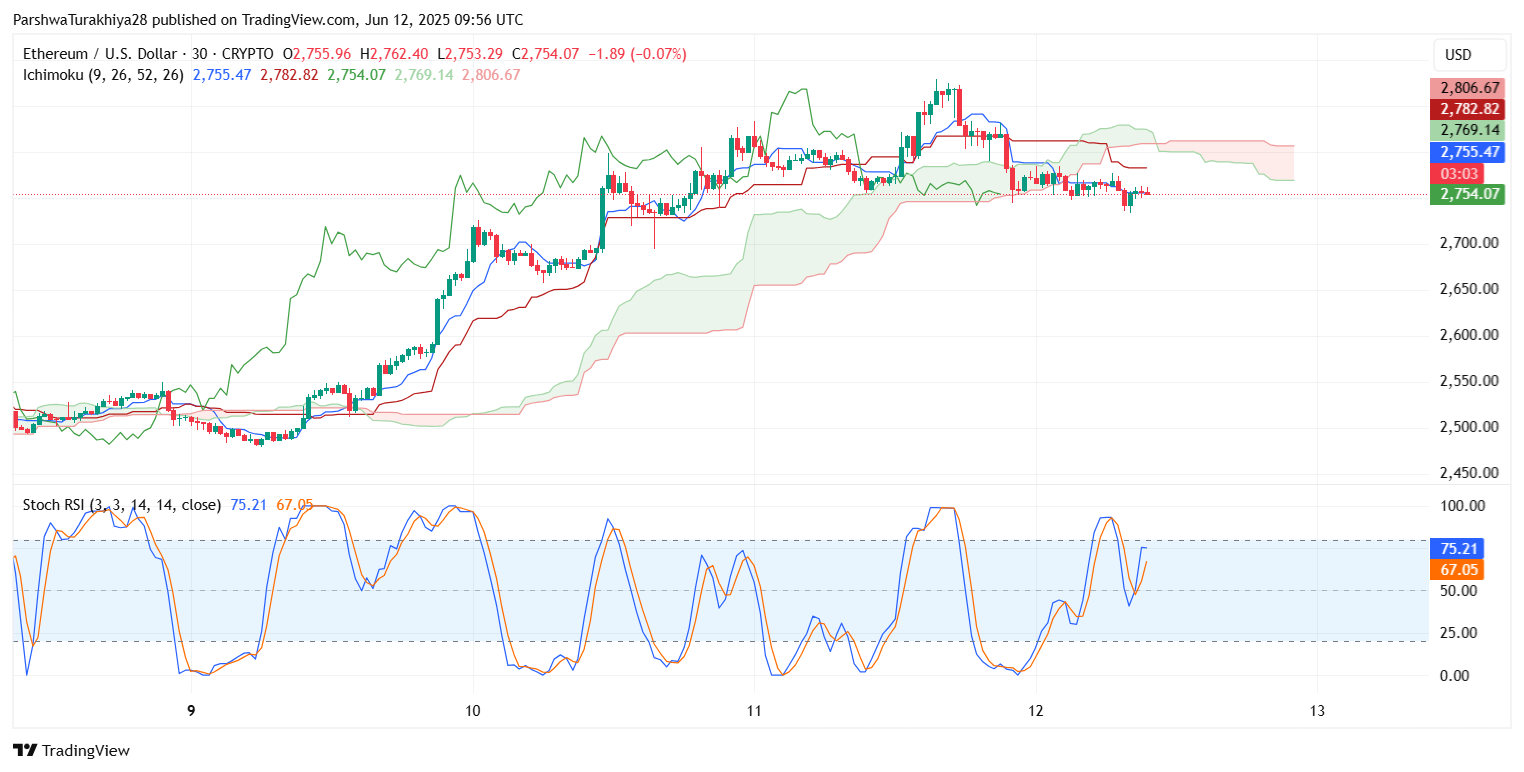
Stochastic RSI on the 30-minute chart shows a rebound forming from the oversold band, with %K and %D lines rising toward the mid-range. A crossover above 50 could mark a fresh bullish wave if supported by price action.
The Ichimoku Cloud is still favorable on higher timeframes, but on the lower timeframes price is hugging the flat Kijun-Sen line, reflecting indecision. For now, the cloud base near $2,745 must hold to avoid deeper pullbacks.
Bollinger Bands And EMAs Offer Key Trend Confirmation
ETH price dynamics (Source: TradingView)
On the 4-hour Bollinger Band structure, Ethereum price is compressing near the middle band at $2,718, after briefly touching the upper band resistance near $2,921.62. A breakout or breakdown from this range could define direction heading into mid-week.
The EMA cluster (20/50/100/200) is stacked bullishly below price, with the 20 EMA at $2,722.11 and the 50 EMA at $2,647.47. As long as price remains above the 20/50 EMA band, the short-term trend bias remains intact. The 100 EMA at $2,598 is also rising, reinforcing the uptrend floor.
Weekly Fibonacci Levels Hold the Key

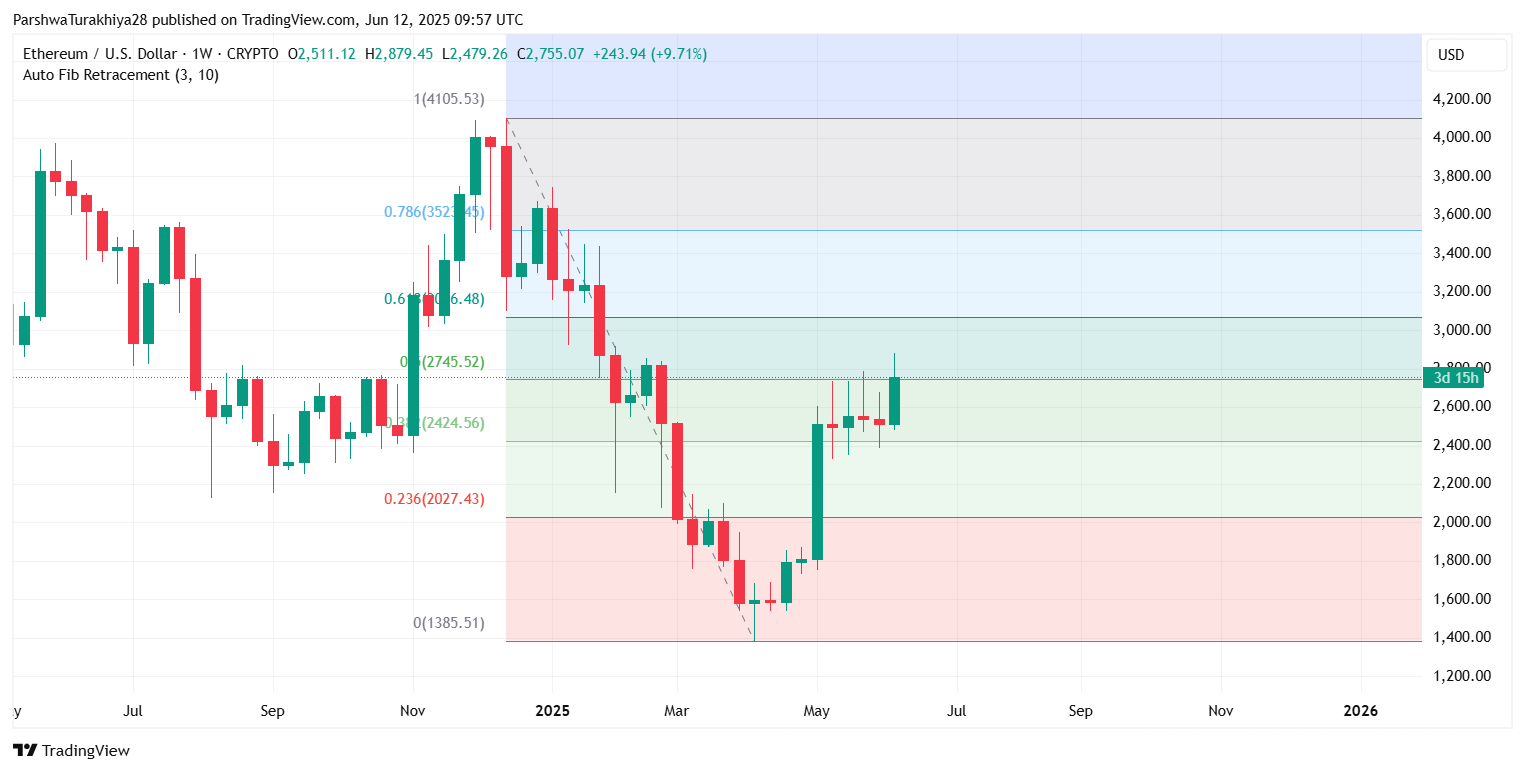
ETH price dynamics (Source: TradingView)
From the weekly perspective, Fibonacci retracement from the 2024 high to the March 2025 low shows Ethereum price today holding above the 0.618 level at $2,746. A close above this zone this week would solidify medium-term bullish continuation, with targets at the 0.786 Fib ($3,525) and the full 1.0 extension near $4,100 if momentum sustains.
Conversely, a breakdown below $2,700 could lead to a retest of $2,600 or even $2,515, where the 200 EMA aligns with a strong historical demand block.
Short-Term Forecast: Ethereum Price Levels to Watch
Why is the Ethereum price going up today? The answer lies in the successful wedge breakout, strong EMA alignment, and price holding above the key Fibonacci level at $2,745. However, cautious intraday sentiment is slowing momentum as traders wait for confirmation above $2,800.
If buyers maintain control, Ethereum price may soon attempt another push toward $2,920 and above. On the downside, failure to hold above $2,745 could trigger a slide to the next support band near $2,600.
Disclaimer: The information presented in this article is for informational and educational purposes only. The article does not constitute financial advice or advice of any kind. Coin Edition is not responsible for any losses incurred as a result of the utilization of content, products, or services mentioned. Readers are advised to exercise caution before taking any action related to the company.
Read the full article here


