Ripple’s price has recently entered a phase of sideways consolidation, following a significant downtrend, leaving market participants uncertain about its future trajectory. However, the cryptocurrency seems likely to remain confined within a tight range until a breakout occurs in either direction.
By Shayan
The Daily Chart
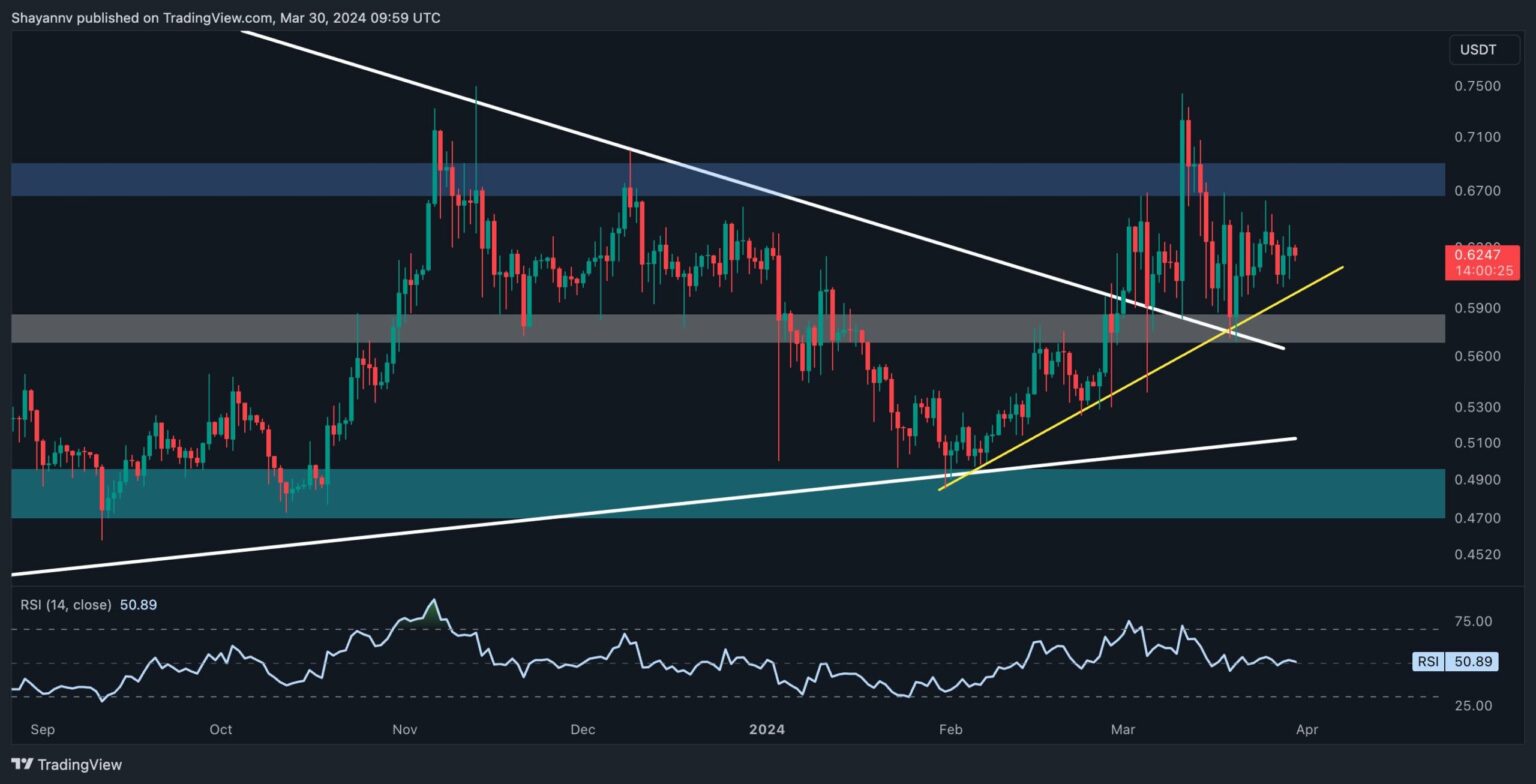
Upon close examination of the daily chart, Ripple’s market activity has diminished, with the price undergoing sideways consolidation characterized by extremely low volatility after experiencing a notable decline from the $0.75 threshold.
Despite this, the price has found considerable support within a crucial price range, indicated by the static region of $0.58 and the dynamic support of the triangle’s lower boundary. This suggests the dominance of buyers near this crucial level.
Nonetheless, Ripple’s price appears trapped, bounded by the $0.66 and $0.58 region in the mid-term until a breakout occurs.
The 4-Hour Chart
A closer inspection of the 4-hour chart reveals Ripple’s indecisive price action following a notable decline around the $0.74 region. However, XRP found support at the crucial $0.56 region, leading to a phase of sideways consolidation.
Nonetheless, Ripple’s price is anticipated to remain within the substantial $0.57 support region and the notable $0.66 resistance level, suggesting the possibility of prolonged consolidation within this pivotal range until a breakout occurs.
A breach above the $0.66 threshold would likely pave the way for a surge toward the $0.74 resistance level as the next focal point for Ripple’s price trajectory.
Read the full article here

