


 Price Prediction for June 7")


After a steep retracement earlier this month, SUI price today is showing signs of recovery near the $3.18 mark. The rebound comes after bulls defended key support near $3.00, a level that coincides with the 0.382 Fibonacci retracement on the weekly chart. This level has now become a crucial pivot for the short-term direction of SUI price, as market sentiment begins to stabilize.
What’s Happening With SUI’s Price?
SUI price dynamics (Source: TradingView)
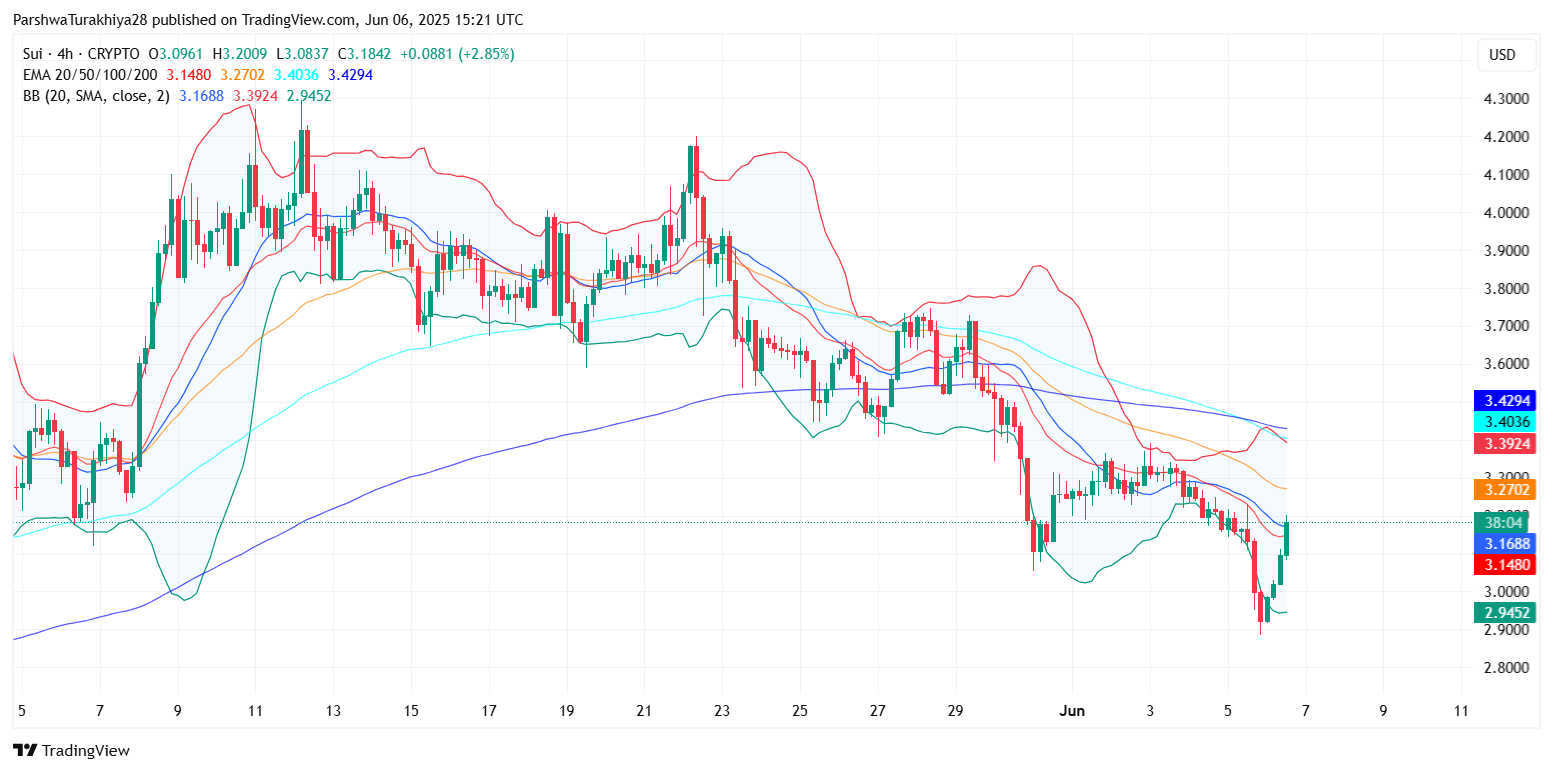
The recent drop in SUI price from May highs around $4.07 brought price action sharply down toward the $3.00 psychological handle. This correction came after failing to break the descending trendline resistance on the daily chart, which continues to pressure upward momentum. However, the strong bounce from $2.91 has reintroduced volatility, with a 9% gain posted on June 6 alone.
The 4-hour timeframe shows SUI price action reclaiming ground above the $3.15–$3.18 short-term resistance, now retested as support. Importantly, this bounce coincided with a break above a falling wedge structure and a reclaim of the 20-EMA and middle Bollinger Band, signaling that bulls are regaining short-term control.
SUI Price Technical Overview
SUI price dynamics (Source: TradingView)
EMA and Bollinger Band Structure
SUI price dynamics (Source: TradingView)
RSI, MACD, and Momentum IndicatorsThe 4-hour chart shows price surging past the 20/50 EMA cluster at $3.14–$3.27. The upper Bollinger Band at $3.39 was also tested, and the bounce is now pressing toward the $3.40–$3.42 zone, where the 100/200 EMAs converge. Sustained movement above this range may open room for a test of the higher liquidity zone near $3.60.
The Bollinger Bands are widening, indicating rising SUI price volatility, which supports the possibility of another leg higher in the short term if momentum persists.
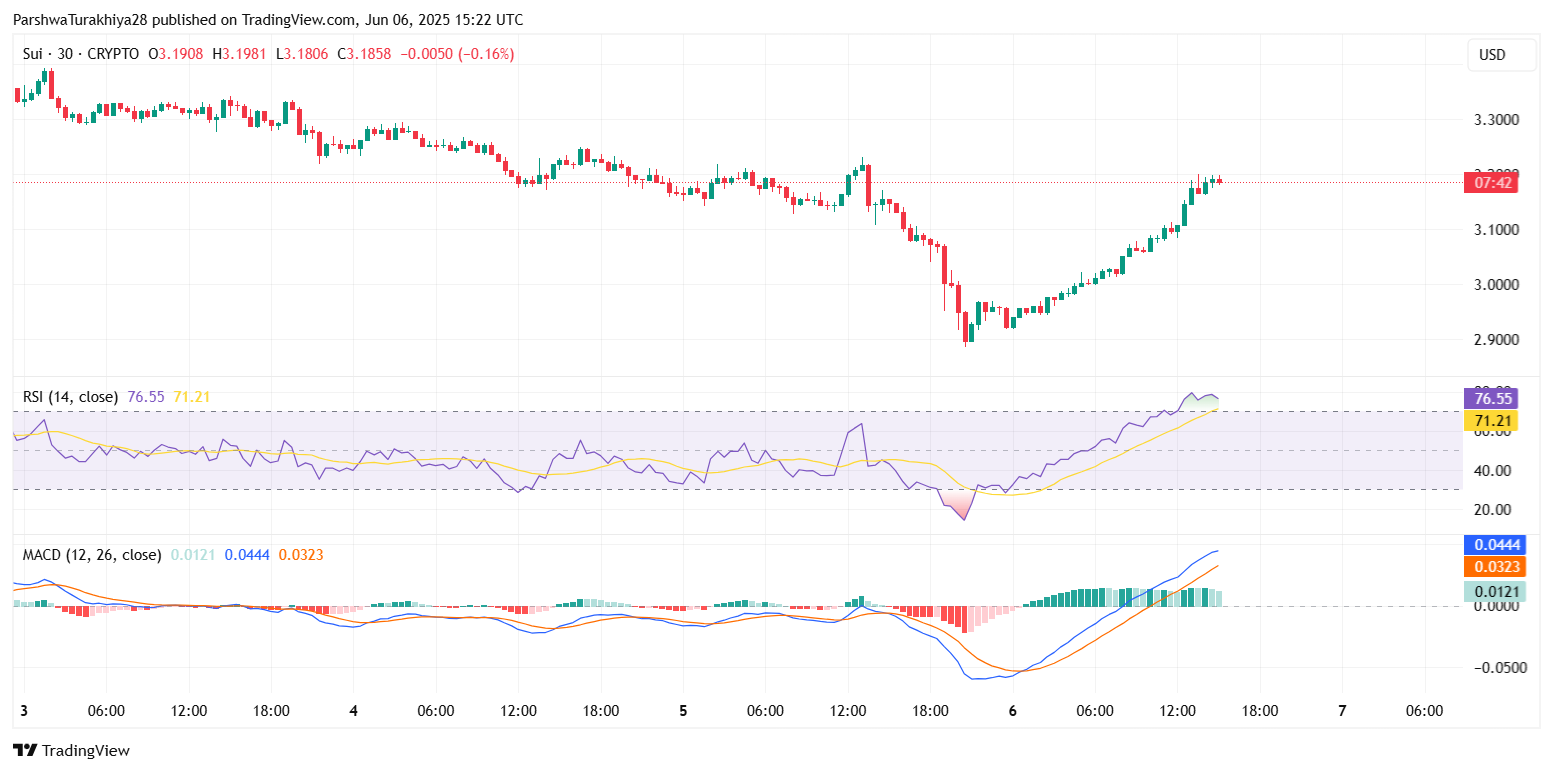
The 30-minute RSI is hovering above 76, showing clear bullish momentum but also slightly overbought conditions. While this suggests the move may be due for a pause, the MACD remains supportive with a bullish crossover and expanding histogram bars, reflecting positive momentum.
Stochastic RSI has crossed into the extreme zone above 90, signaling short-term overheating but not yet reversing. Traders should watch for any bearish divergence or weakening slope that may hint at a local top.
Ichimoku and Trendline Confluence
SUI price dynamics (Source: TradingView)
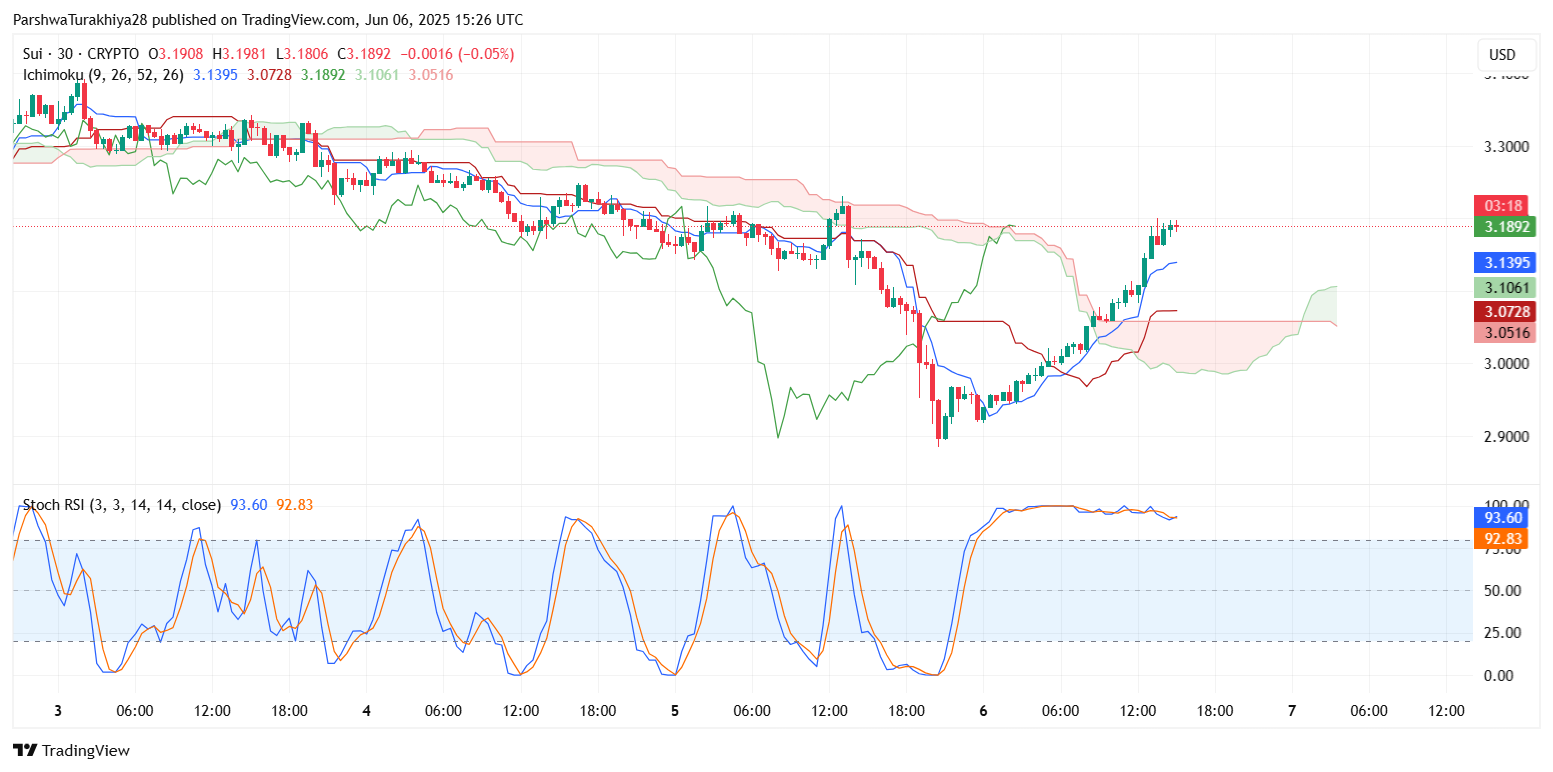
Ichimoku analysis on the 30-minute chart adds further support to bullish continuation. The SUI price is trading above the Kumo cloud, with the Tenkan and Kijun lines aligned bullishly. The leading span A is widening above span B, indicating positive trend development.
Meanwhile, on the 1-day timeframe, the descending trendline from the $4.07 peak is still unbroken. Price has approached this resistance again near $3.20–$3.25. A confirmed breakout and daily close above this level would significantly shift structure in favor of bulls, potentially enabling a rally toward the $3.55–$3.60 range.
Short-Term Outlook: Why SUI Price Going Up Today
SUI price dynamics (Source: TradingView)
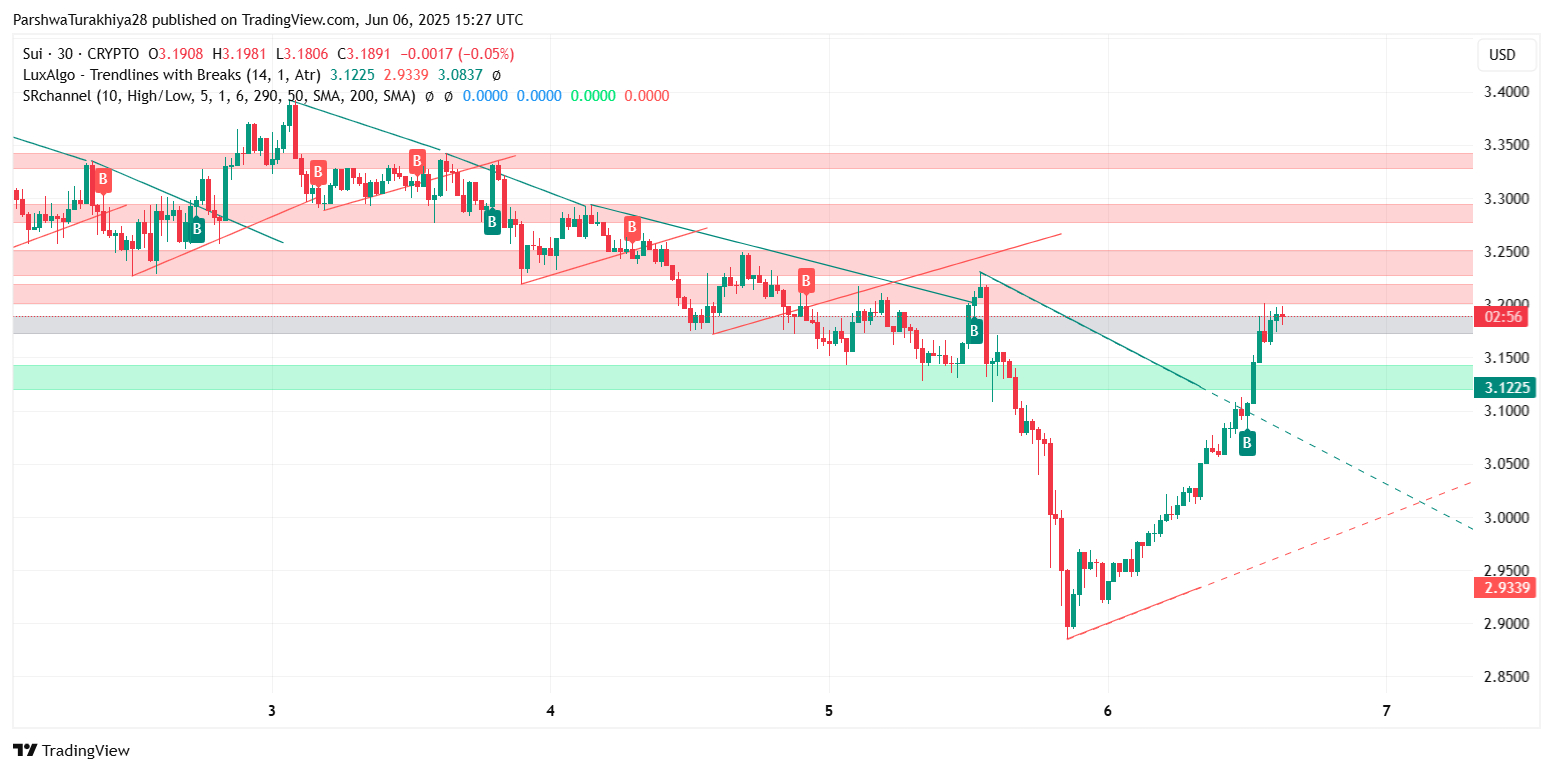
The sharp bounce from the $2.91 low and reclaim of EMAs suggest an early phase of bullish reversal. One reason why SUI price going up today is the strong buyer interest near the weekly Fibonacci 0.382 support at $3.11, where long wicks on multiple timeframes show absorption of selling pressure.
Another key driver is the favorable momentum signals across MACD and RSI on intraday charts, combined with breakout attempts from falling wedge formations. The narrowing of supply zones on the 30-minute and 4-hour charts also reflects reduced resistance toward $3.40.
However, failure to hold above $3.15 could expose price back to the $3.00–$2.95 region. The area near $2.93, marked by a prior breakout base and EMA crossovers, remains a major short-term demand zone.
Final SUI Price Forecast and Key Levels

SUI price dynamics (Source: TradingView)
Heading into June 7, the technical setup for SUI price leans cautiously bullish, provided the $3.15 level holds. A break above the $3.42–$3.45 resistance band could accelerate upside toward $3.60–$3.67. On the downside, a loss of $3.00 would weaken the structure and place the $2.75 support in focus.
SUI price today is showing resilience after a sharp selloff, and bulls are beginning to reclaim lost territory. While upside is likely capped until a daily breakout occurs, momentum indicators point to continuation potential. Traders should remain alert for signs of exhaustion or a trendline rejection near $3.40, but as long as price stays above $3.00, the broader recovery setup remains intact.
Disclaimer: The information presented in this article is for informational and educational purposes only. The article does not constitute financial advice or advice of any kind. Coin Edition is not responsible for any losses incurred as a result of the utilization of content, products, or services mentioned. Readers are advised to exercise caution before taking any action related to the company.
Read the full article here


