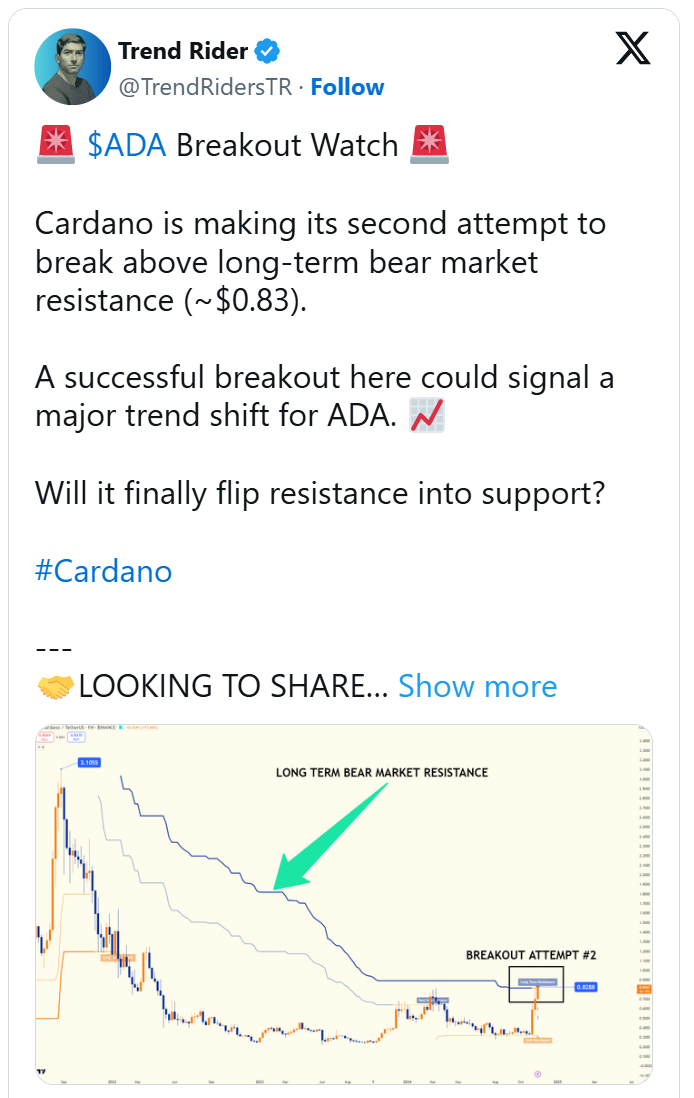
Cardano (ADA) price is close to a significant breakout as it approaches a major resistance line that has been standing during the current bear market.
According to TrendRidersTR, it is in its second breakout attempt at around $0.83, which has restricted upward movement since the 2021 market peak. A breakout might be the start of a strong upward trend that will reverse the trend in ADA and move the price in an upward direction.
ADA Price Long-Term Resistance Zone Faces Retest
The long-term resistance is the thick blue line in the weekly chart which acts as the major psychological level for traders and investors. Cardano attempted to take the price above this level earlier this year but was rejected which led to the price falling back.
– Advertisement –
ADA/USDT trading chart|source X
However, ADA has recently strengthened to retest the same zone demonstrating higher volatility and more buying pressure. A decisive breakout above $0.83 could prove that a new trend is forming, which will boost the market sentiment in Cardano.
Currently, Cardano’s rally shows that buyers are regaining confidence, but the key factor, resistance, cannot be ignored. This way, ADA could turn $0.83 into support, allowing the price to rally with targets at $1.00 and $1.50.

Source: X
However, failure to break through could result in continued consolidation or even a move back to key support levels. If the resistance holds, $0.60, which marks prior accumulation zones, will be crucial in providing support to ADA’s price.
– Advertisement –
Golden Cross Signals Bullish Momentum
ADA recently entered a Golden Cross an indication of strength where a short-term moving average crosses over a long-term moving average.
1-day ADA trading chart|source Tradingview
The 13-day moving average crossed above the 49-day moving average, proving the upward movement that has fueled ADA’s recent price rise.
Historically, Golden Cross formations often precede sustained bullish trends, provided that key support levels hold during consolidation phases.
Cardano reached a recent daily high of $0.8191, just below the critical resistance at $0.83, before pulling back slightly to $0.7758. These pullbacks could be a result of traders taking in profits not necessarily a bearish trend yet.
Short-term support levels to monitor include the 13-day moving average at $0.6629, which aligns with recent price action, and horizontal support at $0.4885, a prior consolidation zone.
If ADA price holds to these support levels, it would create the necessary momentum to test and possibly breach the $0.83 resistance.
Capital Inflows Reinforce Bullish Sentiment
The next positive signal is the Chaikin Money Flow (CMF) which shows the flow of capital inside and outside the market.
Looking at the daily trading chart, CMF is at 0.13 indicating that there is buying pressure in the market among traders, thus net capital is flowing into Cardano. This is a positive signal from indicators the bullish market outlook is supported.
For now, all eyes are on ADA price ability to close above the $0.83 resistance in the weekly timeframe.
A breakout would probably pull in more buyers and swing the market in favor of the bulls. On the other hand, a rejection could lead to the continuation of the bearish structure, lessening the prospect of a bounce towards $1.00 or beyond and possibly dropping to $0.60 or below.
Read the full article here

