The cryptocurrency market is heating up after nearly two months of a downtrend as bullish divergences surge as signals of a possible reversal. Finbold has gathered data on May 10, identifying these signals to help crypto investors navigate these times.
Notably, TradingView‘s total crypto market cap index is now valued at $2.19 trillion, testing a short-term uptrend support. Since April 12, the index has traded below the 30-day exponential moving average (30-EMA), creating resistance at $2.285 trillion. A breakout from this level could propel the market to this year’s highs at $2.72 trillion.
Moreover, its downtrend has been since March 14 but could soon be challenged by growing momentum. The daily relative strength index (RSI) signals this possible reversal by breaking out from its downtrend in a bullish divergence.
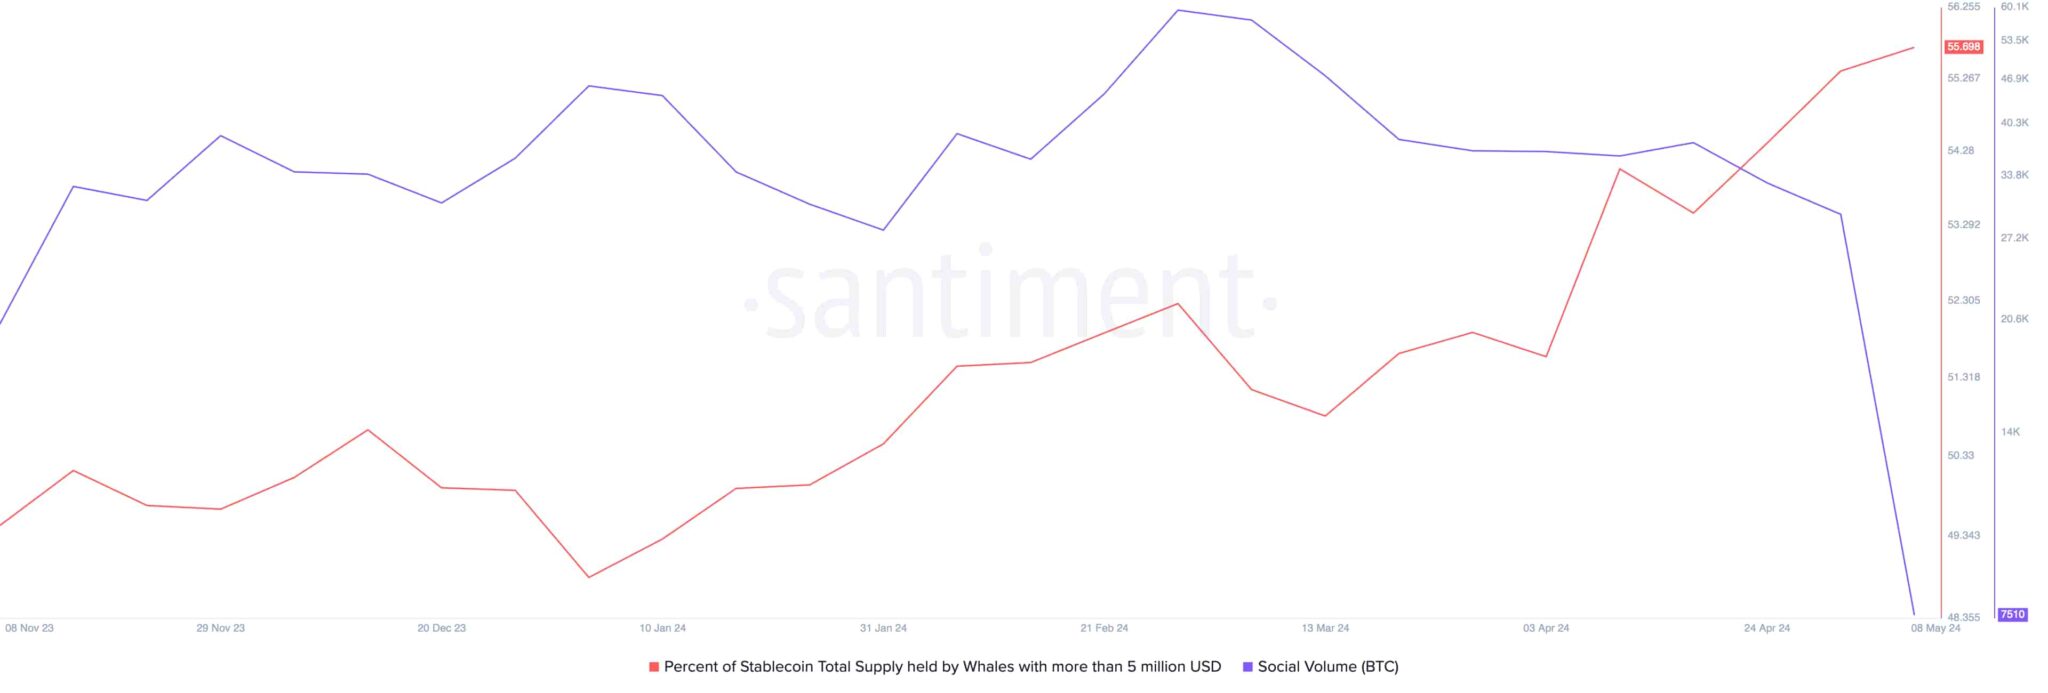
Bullish divergence: Retail stops buying, whales accumulate
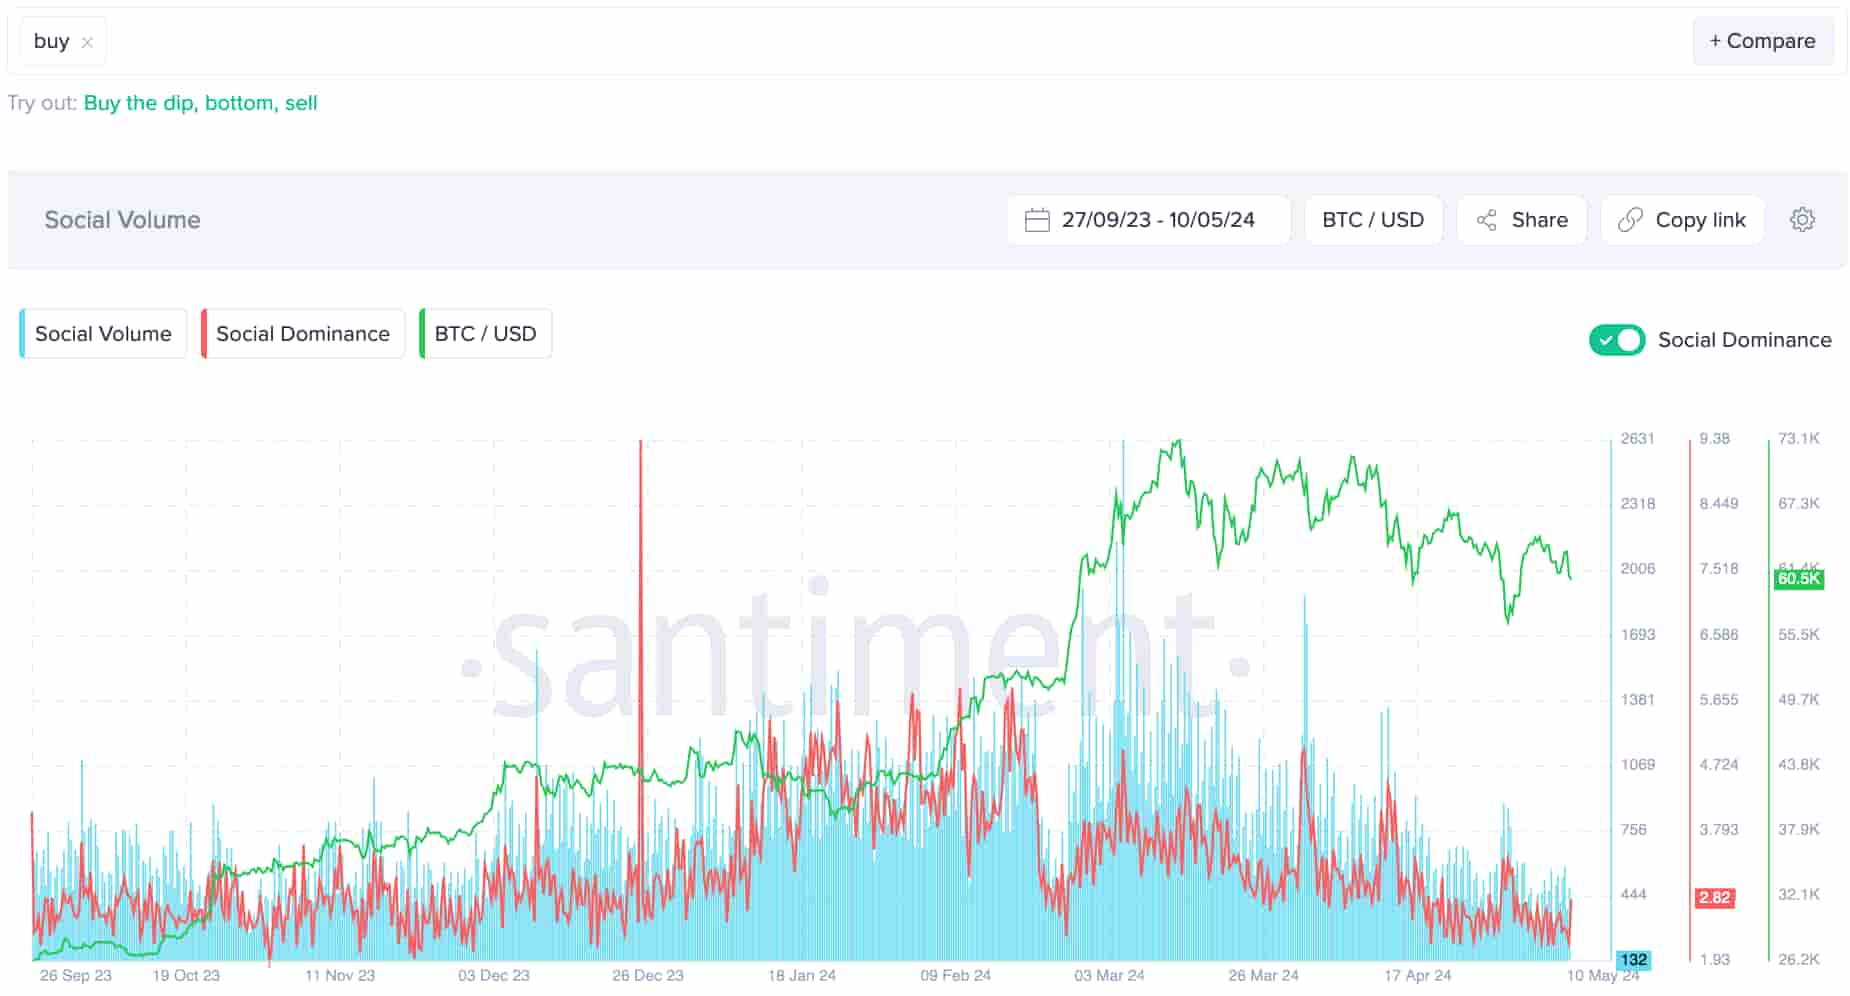
Looking at social indicators on Santiment, the social volume and dominance of the word “buy” have dropped to yearly lows. Under the proper conditions, this momentary lack of interest is usually associated with bottom formations.

Santiment‘s leading analyst, Brian Q, has reached a similar conclusion regarding the crowd’s “buy the dip” chants.

From a world’s regulatory perspective, optimism is surging in India as it reopened its doors to offshore cryptocurrency exchanges like Binance and Kucoin. Conversely, a regulatory crackdown in the United States has led to the withdrawal of popular Bitcoin wallets.
Despite the aforementioned signals, cryptocurrencies remain a highly volatile asset class. Thus, investors must remain cautious while navigating these turbulent waters, looking ahead for fundamental demand and capital inflow as organic signals for long-term price appreciation and sustainability.
Disclaimer: The content on this site should not be considered investment advice. Investing is speculative. When investing, your capital is at risk
Read the full article here


