- DOGE soars 39% to $0.38, testing upper Bollinger Band; renewed investor interest drives market cap up by 2.43% despite lower volume.
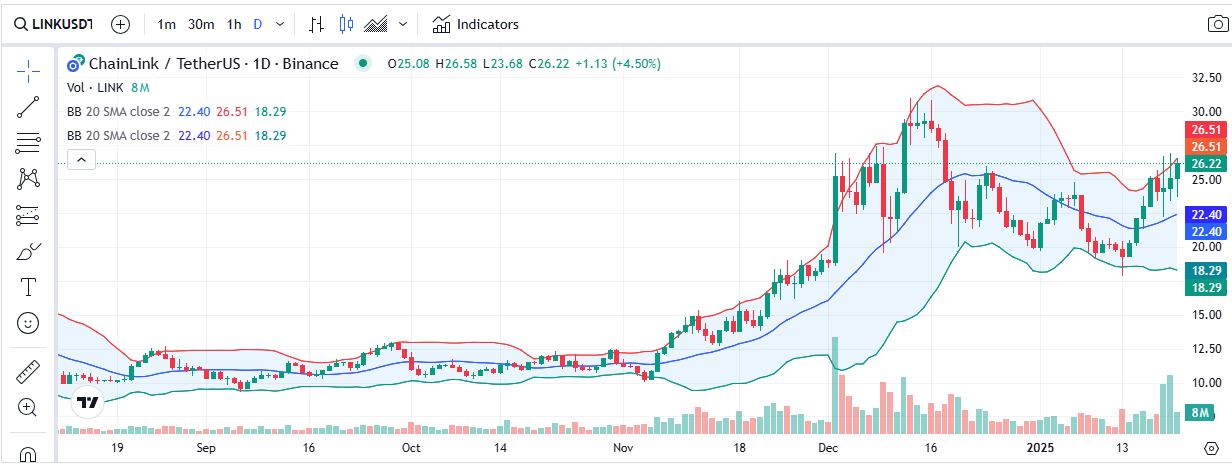
- LINK trades at $25.60, showing bullish momentum near upper Bollinger Band; volume drops 23.33%, but SMA provides strong support.
- BONK gains 4.64%, testing resistance near $0.00003321; market cap hits $2.53B, signaling growing interest despite lower trading volume.
With DOGE, LINK, and BONK showcasing strong rallies and 100x potential, investors are flocking to these tokens. Could this be the ultimate time to ride the meme coin wave to massive gains
Dogecoin(DOGE) Rockets 39%: Is the King of Meme Coins Ready for Another Bull Run?
Source: Coinmarketcap
Dogecoin (DOGE) over the past 24 hours, with the price initially opening at approximately $0.3768. The price experienced a general downward trend throughout the day, hitting lows around $0.34. However, towards the end of the period, the price surged significantly, reaching $0.39, likely influenced by notable news or market events. Despite a daily trading volume decrease of 13.16%, the market cap increased by 2.43%, indicating a strong recovery and renewed investor interest. The recent candle indicates a sharp upward move of 10.89%, with price testing the upper Bollinger Band, suggesting renewed bullish momentum.
Chainlink(LINK) Gains Momentum: Bullish Signals Despite Volume Drop

Source: Coinmarketcap
The graph shows Chainlink’s (LINK) price movement over a 24-hour period, with the price fluctuating between approximately $24 and $26. The current price is $25.60, reflecting a slight daily increase of 0.21%. The market cap is $16.33 billion, and the trading volume over the past 24 hours has been $2.25 billion, which represents a significant decline of 23.33%. The volume-to-market-cap ratio is 13.57%, indicating active trading. The circulating supply is 638.09 million LINK out of a total supply of 1 billion.The Bollinger Bands expanded during the breakout, reflecting heightened volatility, and the current price remains near the upper band, signaling continued bullish pressure. Volume has also spiked recently, reinforcing the upward trend. The 20-day SMA serves as a dynamic support level, currently below the price.
Bonk(BONK) Quiet Surge: Can This Meme Coin Break Resistance for 100x Growth?
Source: Coinmarketcap
The graph displays the price performance of Bonk (BONK) over a 24-hour period. Initially, the price experienced a dip, bottoming out near $0.000029, followed by a recovery in the latter part of the day. The price climbed steadily towards the end of the period, reaching approximately $0.00003321, reflecting a daily increase of 4.64%. Despite the price volatility, the market cap rose to $2.53 billion, while trading volume decreased significantly by 43.91% to $774.31 million, resulting in a volume-to-market cap ratio of 29.72%. These metrics suggest growing investor interest as the token’s price trends upward. BONK has been trading in a sideways pattern, indicating reduced volatility, with occasional attempts to test resistance levels around the upper Bollinger Band. Current volume spikes suggest renewed trading interest, potentially hinting at an upcoming trend shift.
Read the full article here

