


Following former president Trump’s 2024 election victory, the cryptocurrency market has experienced a surge in optimism and buying interest.
Ethereum was no exception, with its price spiking by 10% at one point, reaching the critical resistance level of $2.5K. A sustained break above this threshold could further fuel bullish momentum.
Technical Analysis
By Shayan
The Daily Chart
On the daily chart, Ethereum saw heightened buying activity near the $2.3K support, which coincides with the middle boundary of the multi-month descending channel. This buying pressure drove the asset back toward the 100-day moving average, aligning with the $2.5K resistance zone. This region has seen the presence of sellers in the past, suggesting it is a significant barrier to ETH’s upward movement.
However, if buying pressure continues, Ethereum could potentially break this resistance, leading to a short-squeeze and a continuation of the uptrend. In this bullish scenario, the 200-day MA at $2.8K, aligning with the channel’s upper boundary, would become the next target for buyers.
The 4-Hour Chart
The 4-hour chart highlights the initial surge from $2.3K, a support zone that marked the lower boundary of a descending flag pattern. The concentrated buying pressure at this level has pushed Ethereum to approach a decisive resistance between $2.6K and $2.8K, defined by the 0.5 to 0.618 Fibonacci levels.
This zone represents a substantial supply area and may lead to a short-term consolidation phase as ETH buyers contend with selling pressure.
For Ethereum to mark a confirmed bullish trend, it would need a breakout above this resistance zone with strong volume, which could open the path toward a prolonged uptrend. In the meantime, price action around this resistance level will be pivotal, as it will determine whether Ethereum can build upon its current momentum or faces a temporary pause in its bullish rally.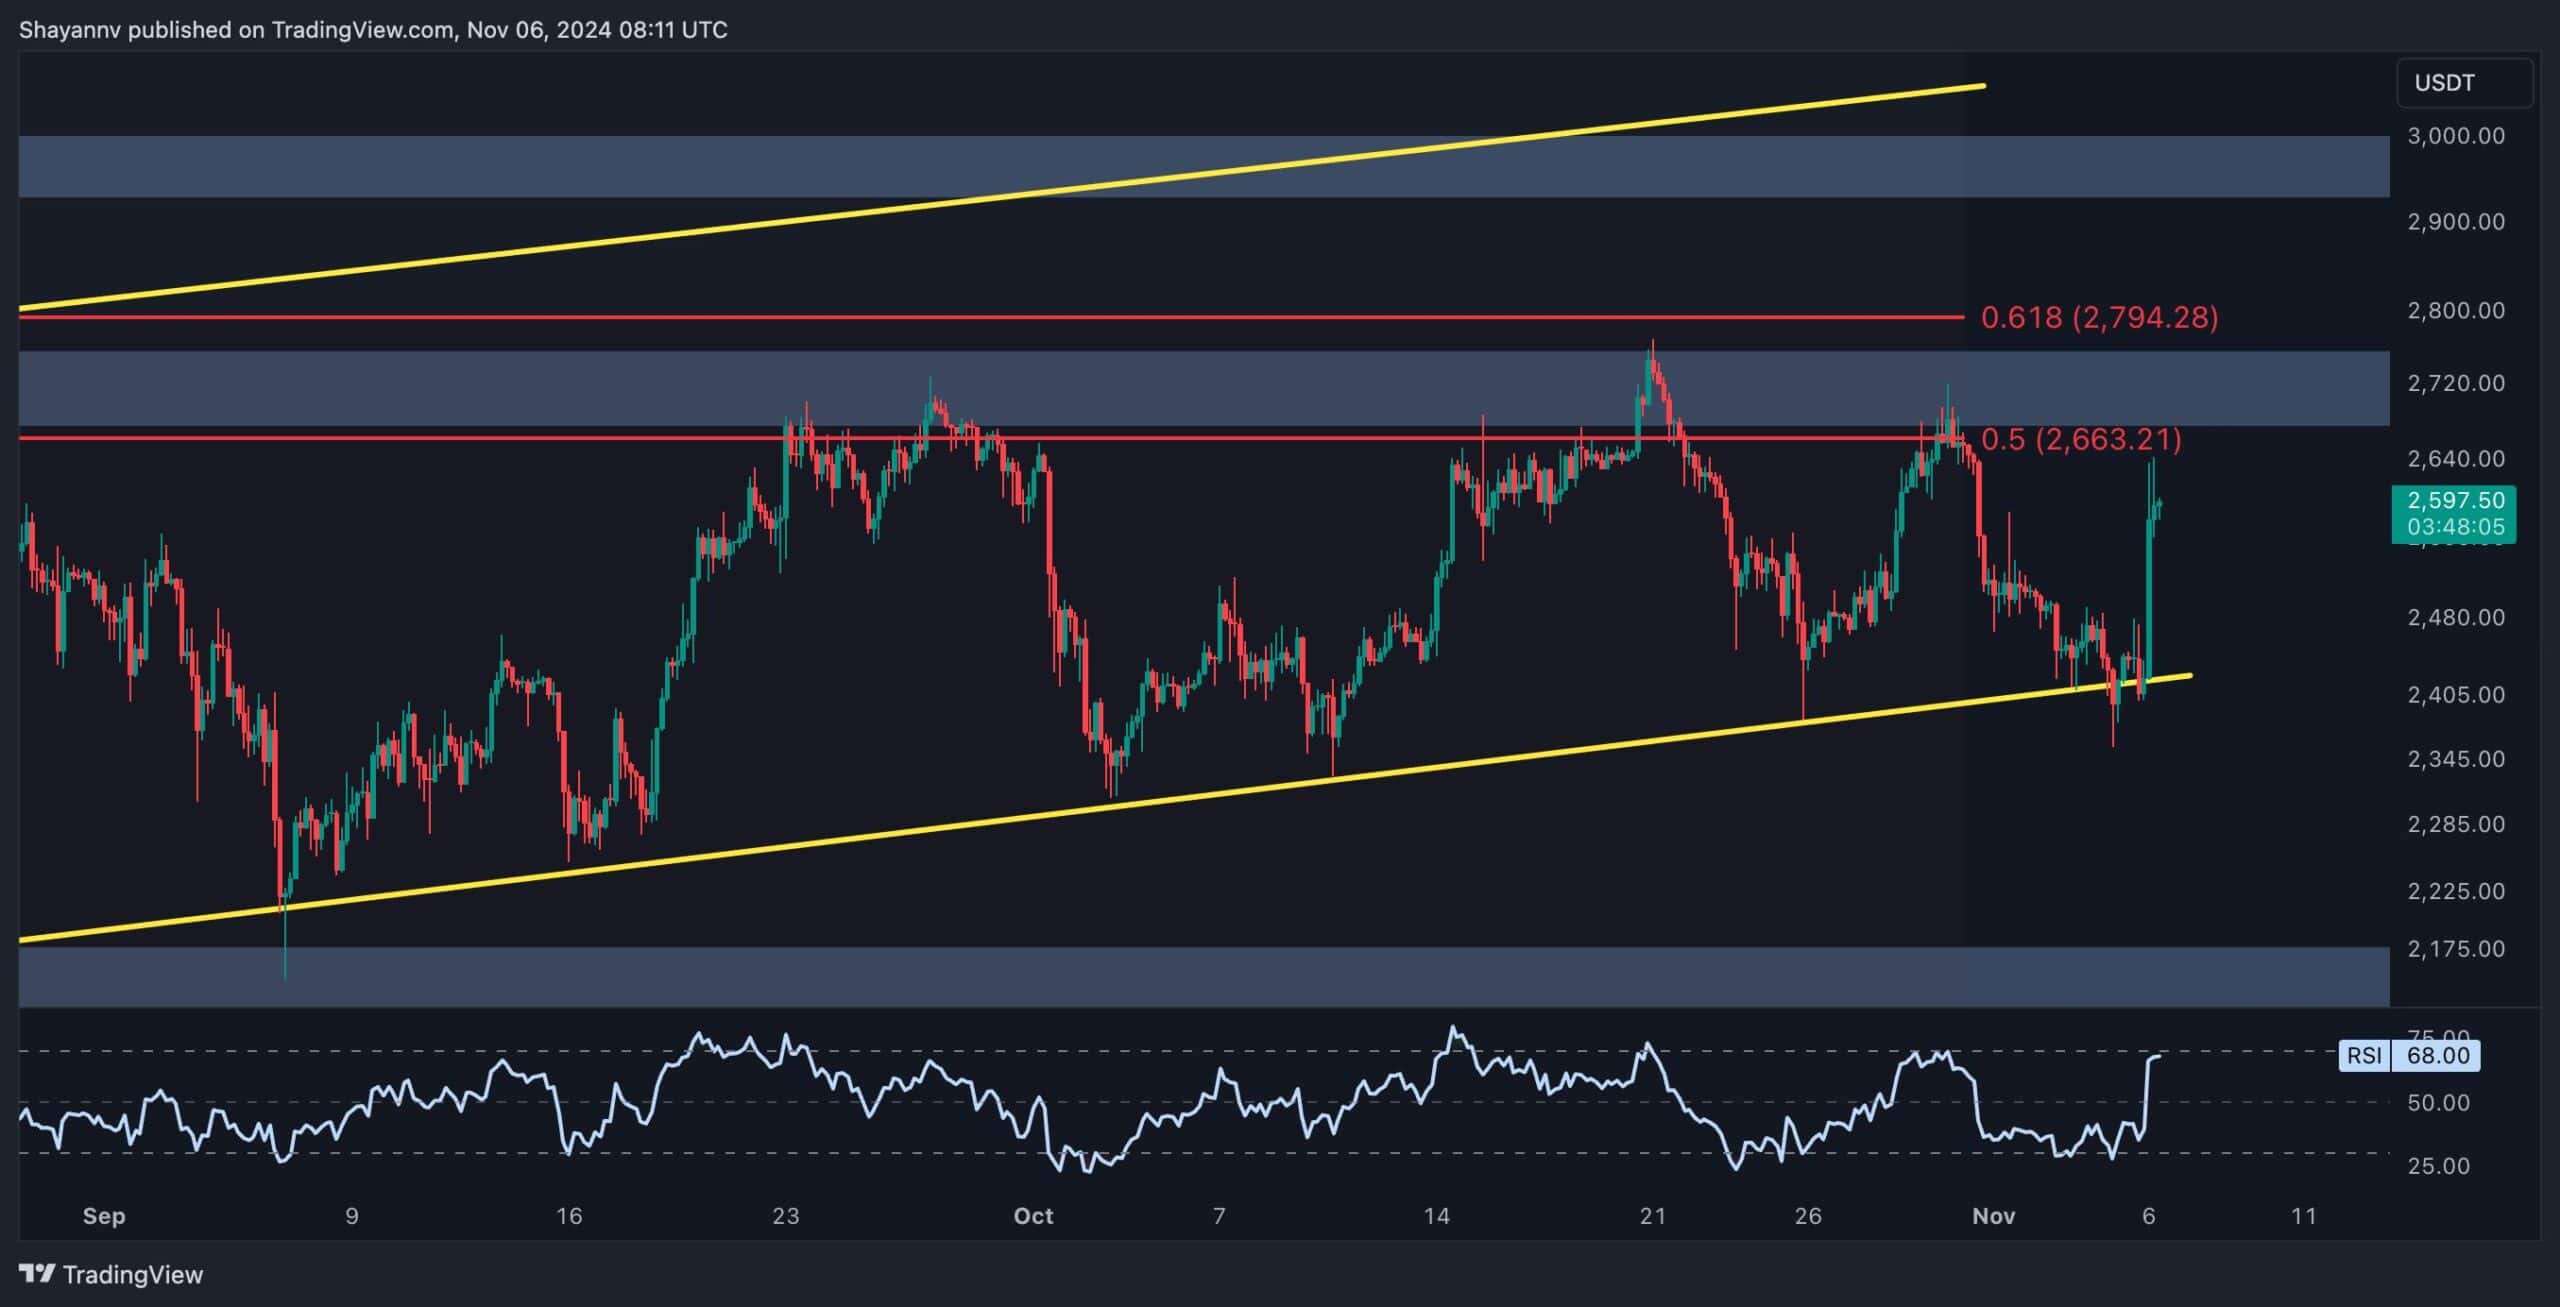
Onchain Analysis
By Shayan
Ethereum’s recent surge toward the $2.5K resistance region has sparked optimism among investors, many of whom anticipate the beginning of a new bullish rally. Key indicators from the futures market, such as open interest and funding rate metrics, provide insight into traders’ sentiment and participation levels.
The chart highlights that both open interest and funding rates have shown positive values during this recent uptrend, reaching levels higher than in previous months. This increase signals increased participation and a generally bullish sentiment among futures traders. While strong participation is often essential for a sustained bull market, overly high optimism in the futures market can also pose risks.
Currently, neither open interest nor funding rates have reached alarming levels, suggesting there is still room for these metrics to rise without immediate risk. However, a sudden spike in these values could introduce heightened volatility and elevate the risk of a long liquidation cascade, which could cause a swift price drop.
Given these dynamics, investors may want to exercise caution in the short term by closely monitoring these metrics and managing risk levels carefully to prepare for potential volatility.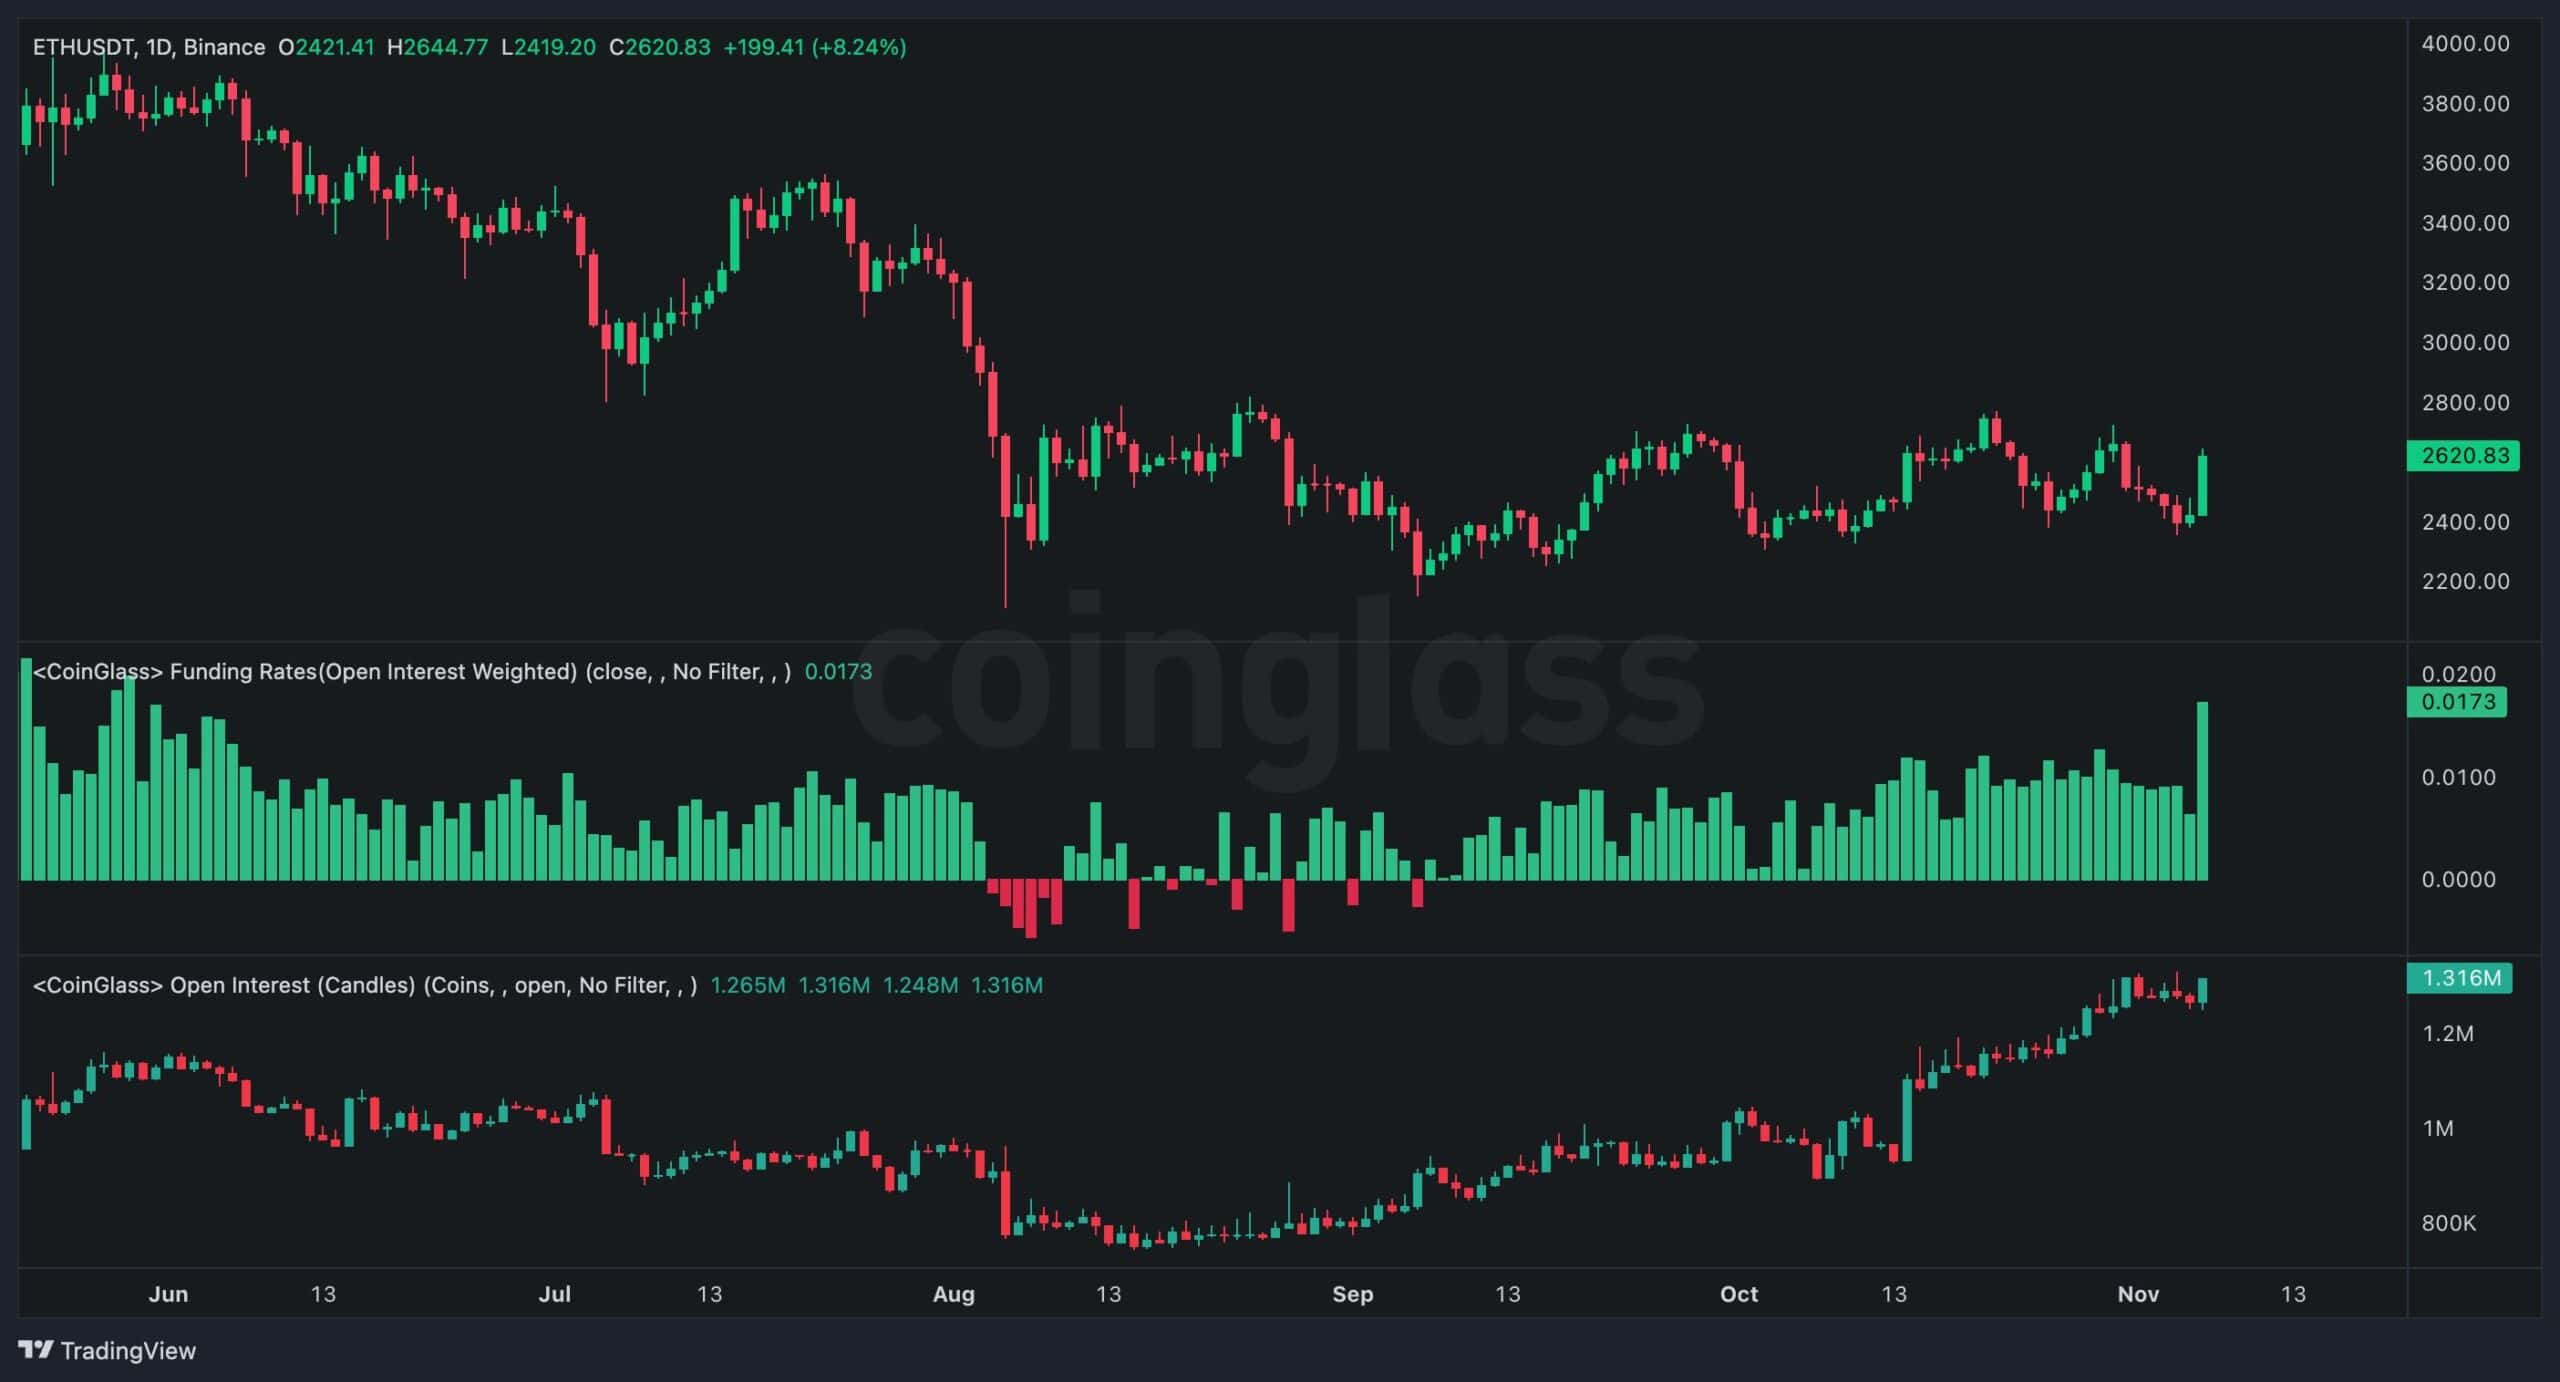
Read the full article here


