


Ethereum price today: $2,620
- Ethereum’s long-term holders increased their selling pressure in the past three days, distributing over 300,000 ETH.
- However, whales have been buying the dip with Ethereum exchange reserves plunging by over 800,000 ETH in the past week.
- Ethereum could experience a decline to $2,200 if it fails to overcome the $2,817 resistance.
Ethereum (ETH) declined by 2% on Tuesday due to increased selling activity from long-term holders (LTHs) and a buy-the-dip strategy from whales. If this selling trend continues, ETH could drop to the support level near $2,200.
Ethereum on-chain data shows mixed sentiment among LTHs and whales
Ethereum long-term holders have begun showing weakness lately as they stepped up their selling pressure in the past three days.
The Dormant Circulation metric, which measures the amount of previously idle tokens that changed addresses, reveals that investors within the 2-year to 3-year cohort moved over 300,000 ETH in the past three days.
ETH Dormant Circulation (2Y & 3Y) and Network Realized Profit/Loss. Source: Santiment
The selling activity has seen investors book over $700 million in profits and $70 million in losses during the same period.
This marks the continuation of a trend that was evident throughout last week where investors continued selling to lock in profits and cut losses.
However, bulls have been quietly buying the dip, as indicated by a decline of over 800,000 ETH in the Ethereum exchange reserves over the past week.
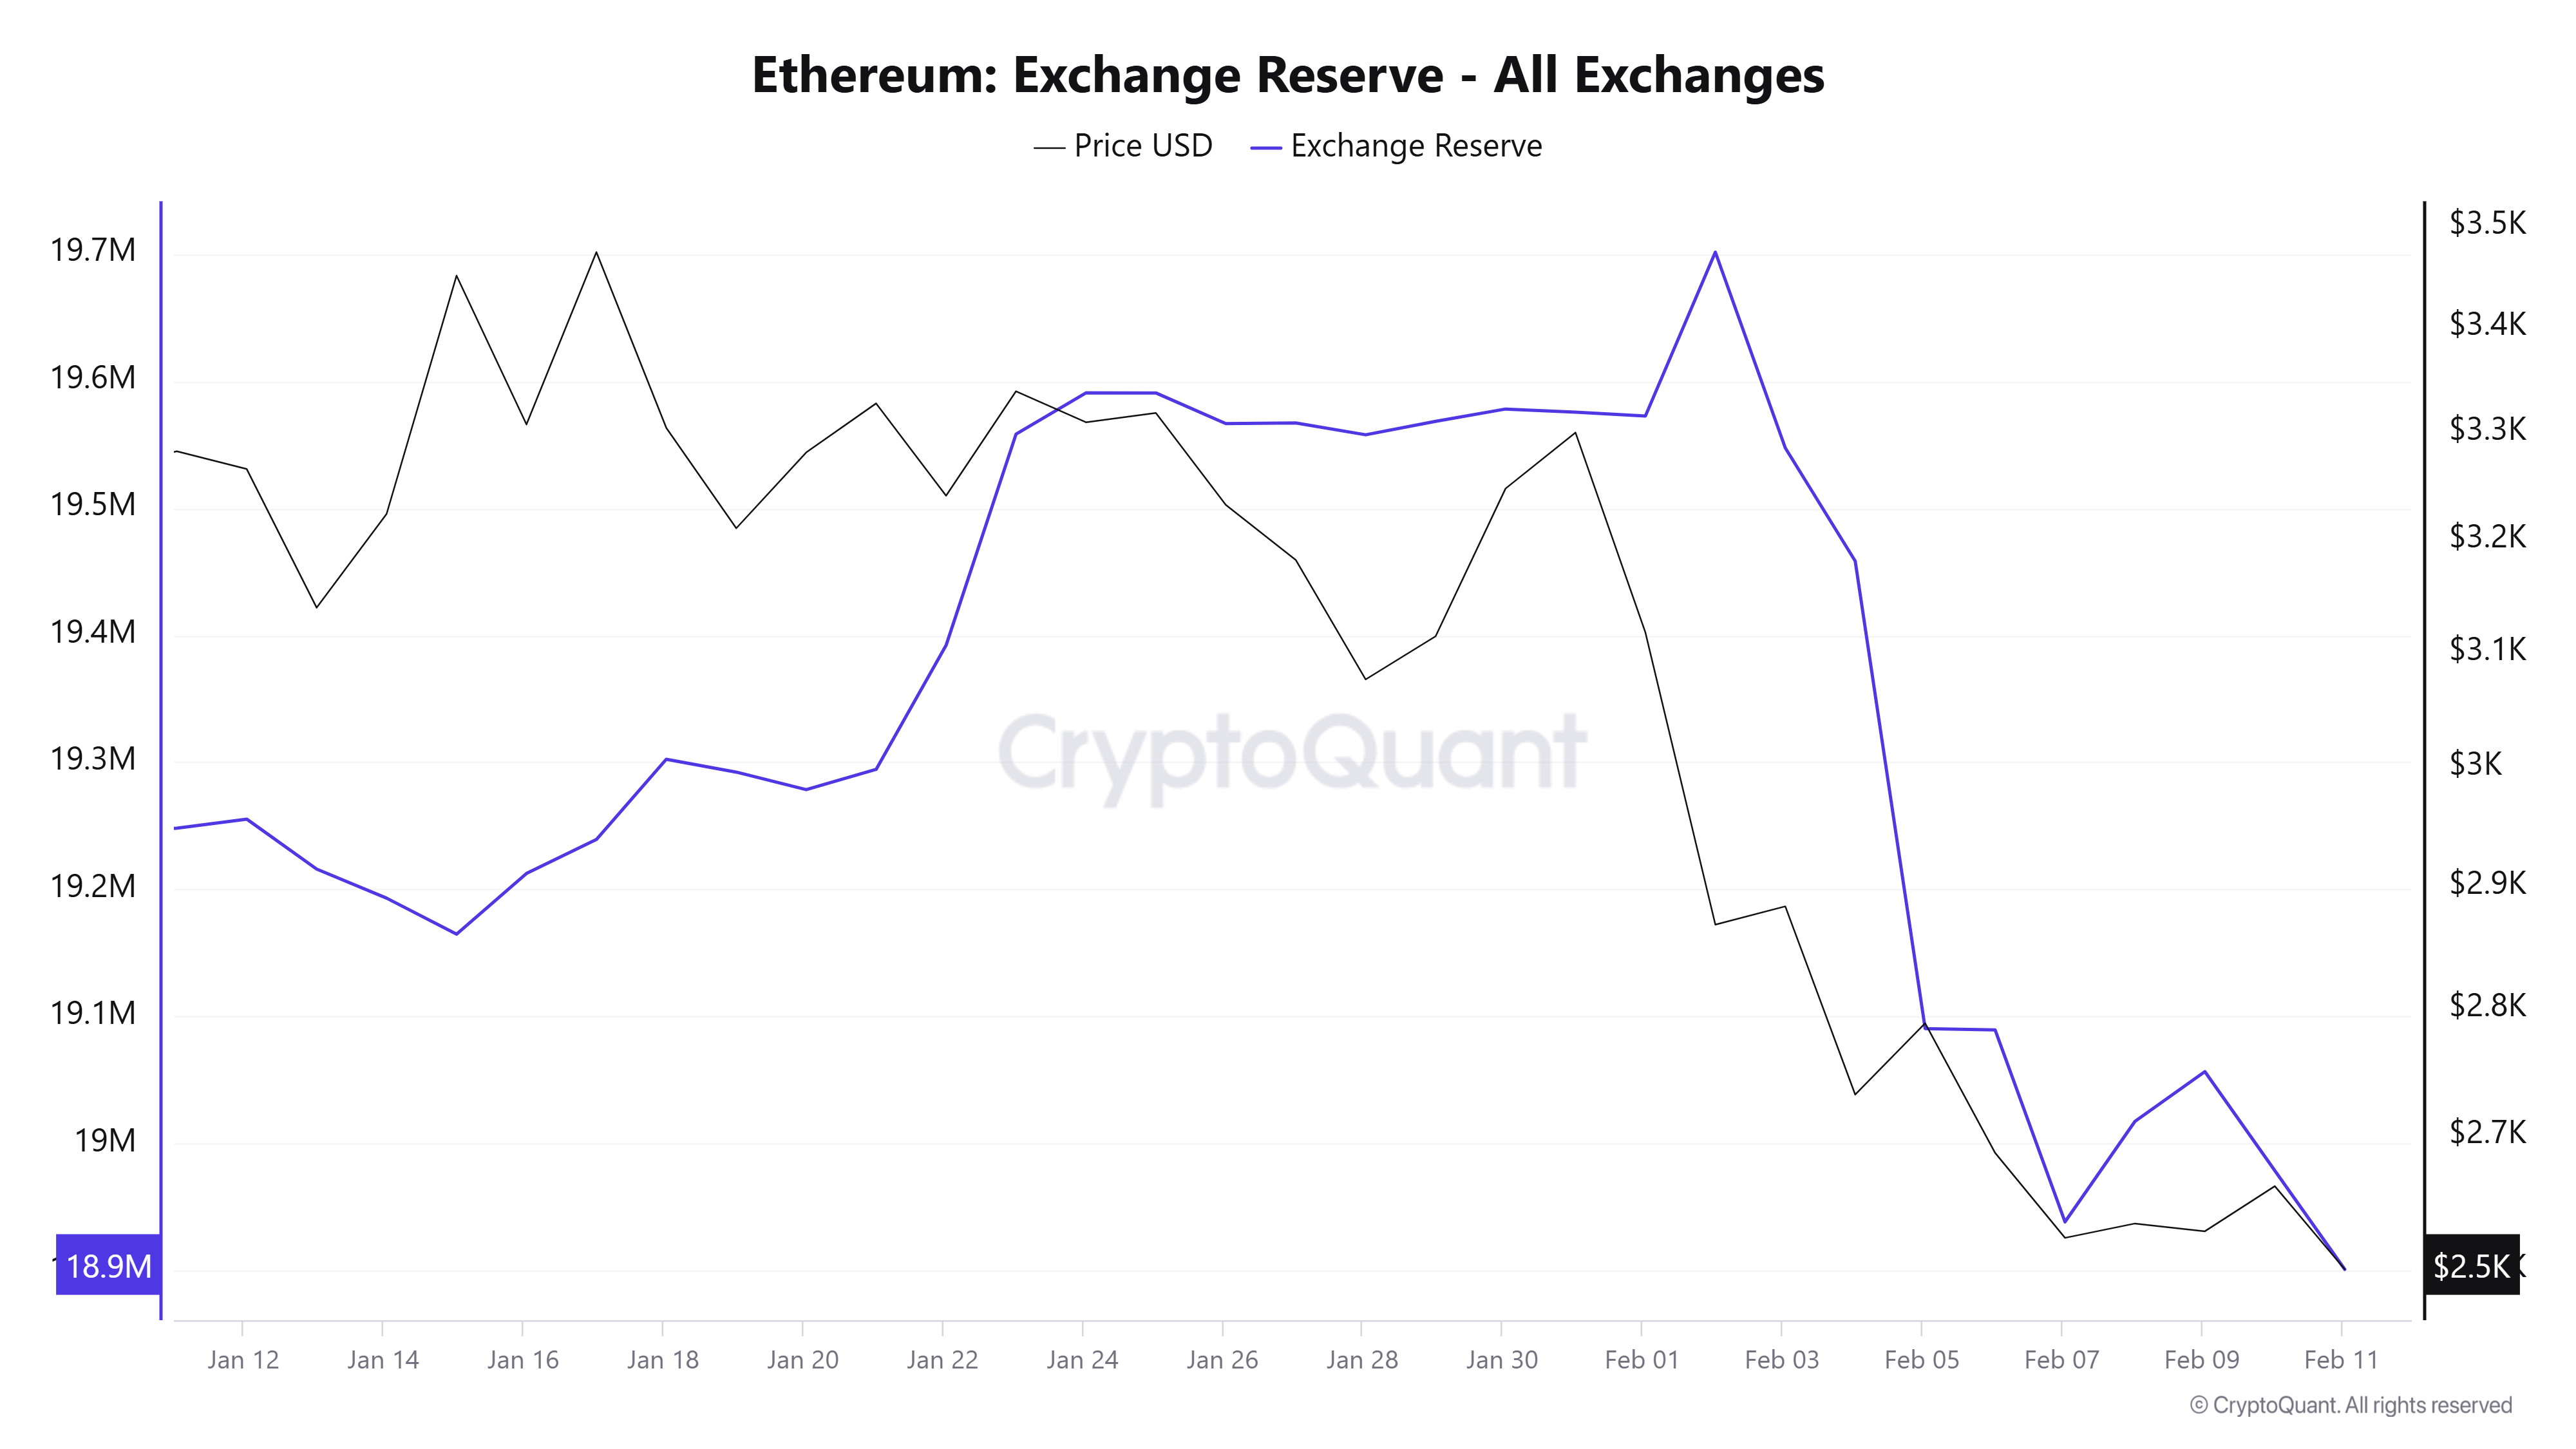
ETH Exchange Reserve. Source: CryptoQuant
The above chart also aligns with data from Lookonchain, which reveals that whales have been accumulating ETH in the past three days.
These 2 whales withdrew another 49,250 $ETH($131M) from #Binance and #Bitfinex.https://t.co/pH4TE7jFKz pic.twitter.com/53wbpvkAFa
— Lookonchain (@lookonchain) February 11, 2025
While investors are buying the dip, Ethereum’s derivatives market has continued to show weakness, with its open interest in the futures market hovering around 8.20 million ETH since declining from an all-time high of 9.90 million ETH on February 3.
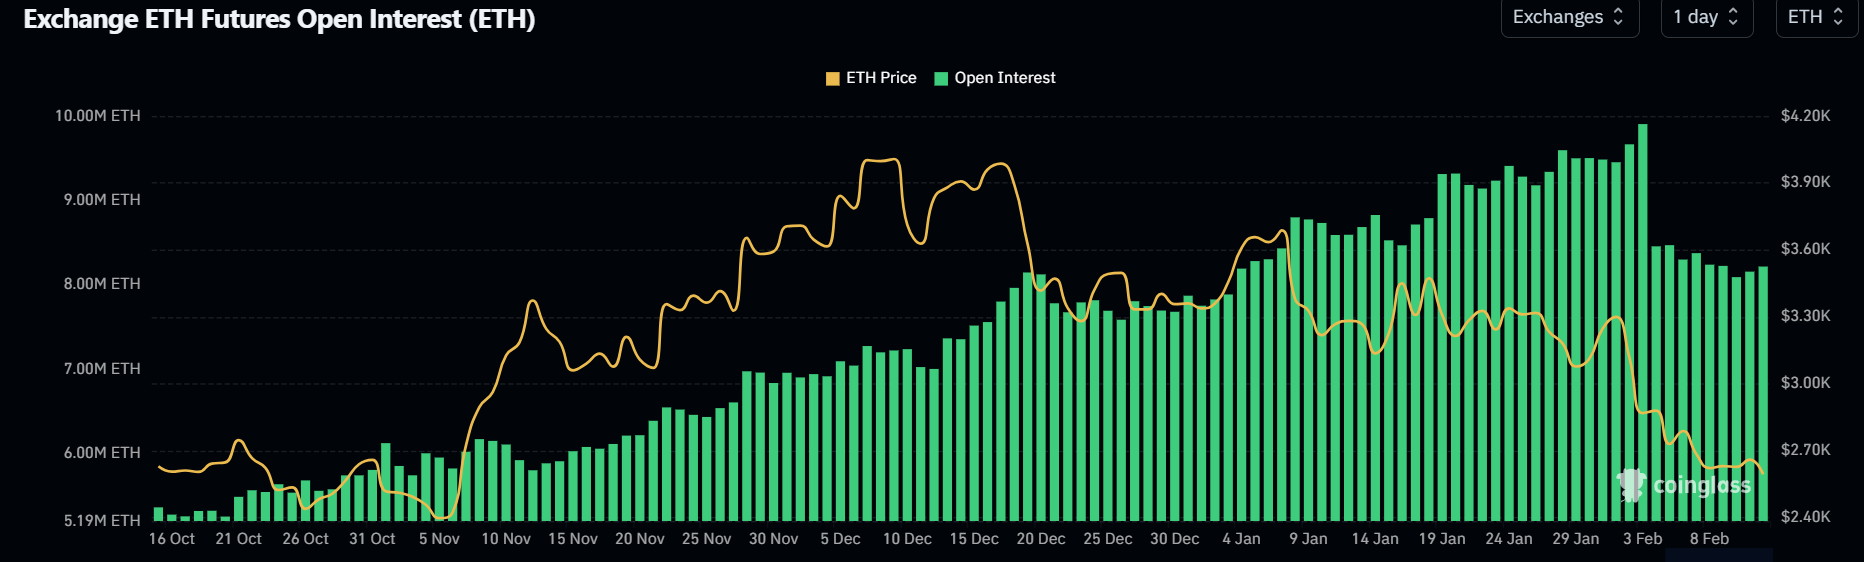
ETH Open Interest. Source: Coinglass
Meanwhile, Ethereum exchange-traded funds (ETH ETFs) broke their six-day positive flows streak after recording net outflows of $22.5 million on Monday, per Coinglass data.
Additionally, Tracy Jin, Vice President of cryptocurrency exchange MEXC, shared her insights on the market outlook for Ethereum in a note to FXStreet:
“In the short term, the volatility of ETH quotes may grow due to increased attention from traders and investors. Historically, any major Ethereum update, especially if it is associated with improved scalability, performance, or reduced fees, causes speculative purchases on expectations of positive changes.
However, before a successful launch on the main network, corrective rollbacks may be observed in the event of technical problems or delays in the testing process. None of the major Ethereum upgrades have been without technical difficulties, delays, and changes, which indicates a high probability of a repeat of this scenario with the Pectra upgrade and increased volatility within 3-6 months.”
Ethereum Price Forecast: ETH risks decline to $2,200 if it fails to overcome $2,817
Ethereum saw $29.15 million in futures liquidations in the past 24 hours, per Coinglass data. The total amount of long and short liquidations accounted for $19.95 million and $9.20 million, respectively.
Since the heavy price decline sparked by global trade tensions on February 3, Ethereum has struggled to see a recovery as bears continue to dominate the market.
The top altcoin’s decline into the rectangular channel, marked by the $2,817 and $2,200 key levels, could signal the beginning of an extended consolidation. ETH traded within this channel for four months between August and November before President Donald Trump’s election victory sparked a crypto market rally.
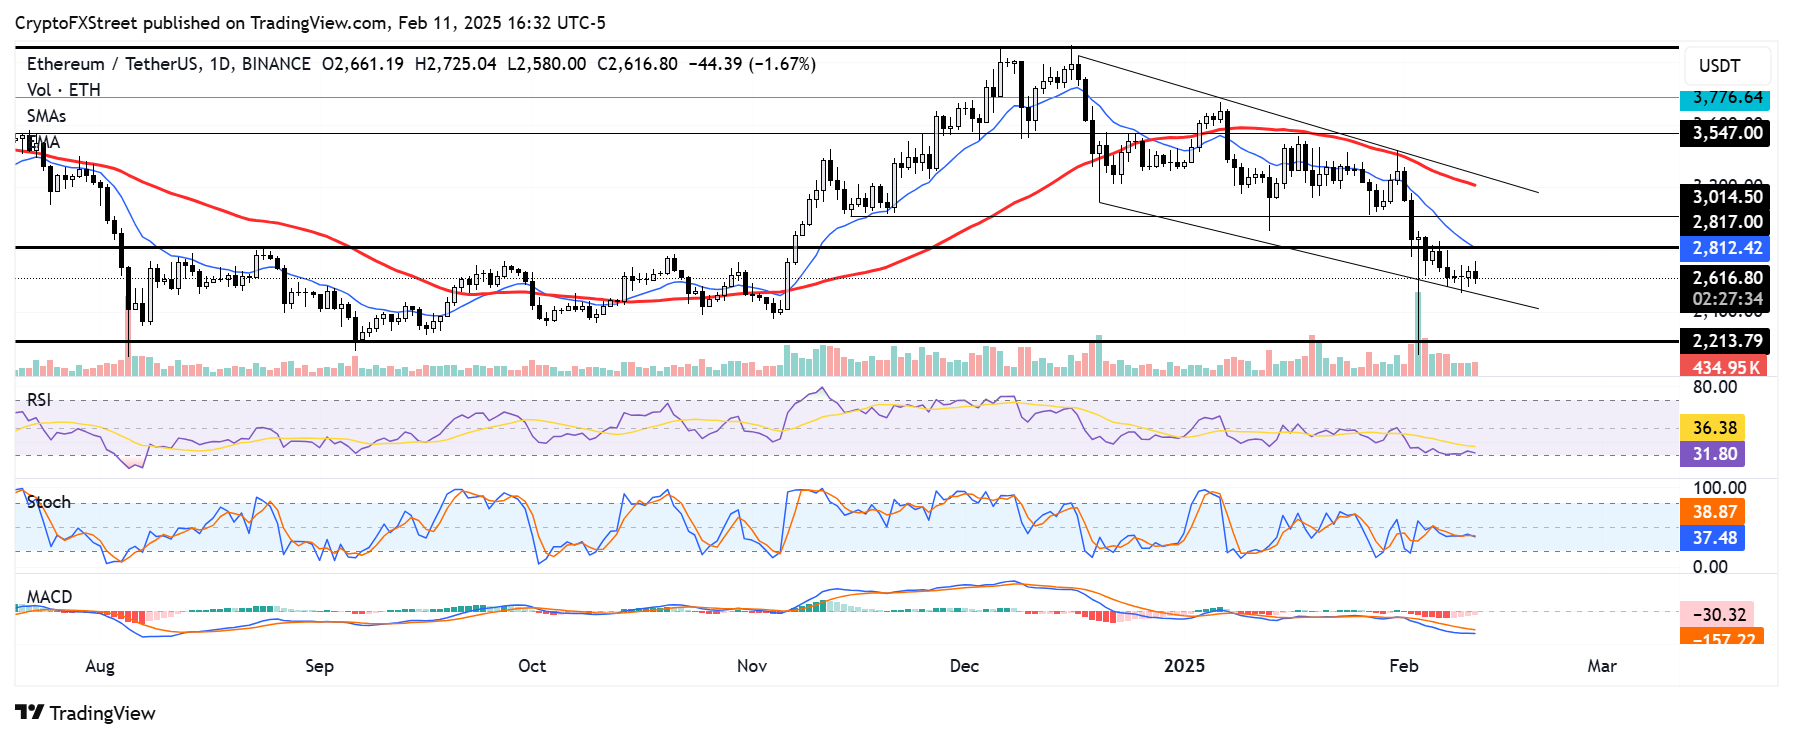
ETH/USDT daily chart
To break out of the potential bearish trend, ETH has to overcome the $2,817 key resistance — which is strengthened by the 14-day Exponential Moving Average (EMA) — and hold it as a support level.
If ETH sees a rejection near $2,817 and declines below the lower boundary of a key descending channel, it could find support at $2,200.
The Relative Strength Index (RSI) and Stochastic Oscillator (Stoch) are below their neutral levels, indicating dominant bearish momentum. The Moving Average Convergence Divergence (MACD) is posting receding histogram bars, meaning the negative momentum is weakening.
Read the full article here

 Price May Hit $3.4K If ETH Holds This Support")

