


The Ethereum price today is trading near $2,244 after a volatile intraday reversal from sub-$2,150 levels. This rebound follows an early-week rejection near $2,620 and marks a critical moment as ETH attempts to hold above the weekly 0.236 Fibonacci level ($2,026).
Price action is now sandwiched between bearish control zones and a key demand cluster, with bulls looking to reclaim lost structure heading into June 24.
What’s Happening With Ethereum’s Price?
ETH price dynamics (Source: TradingView)
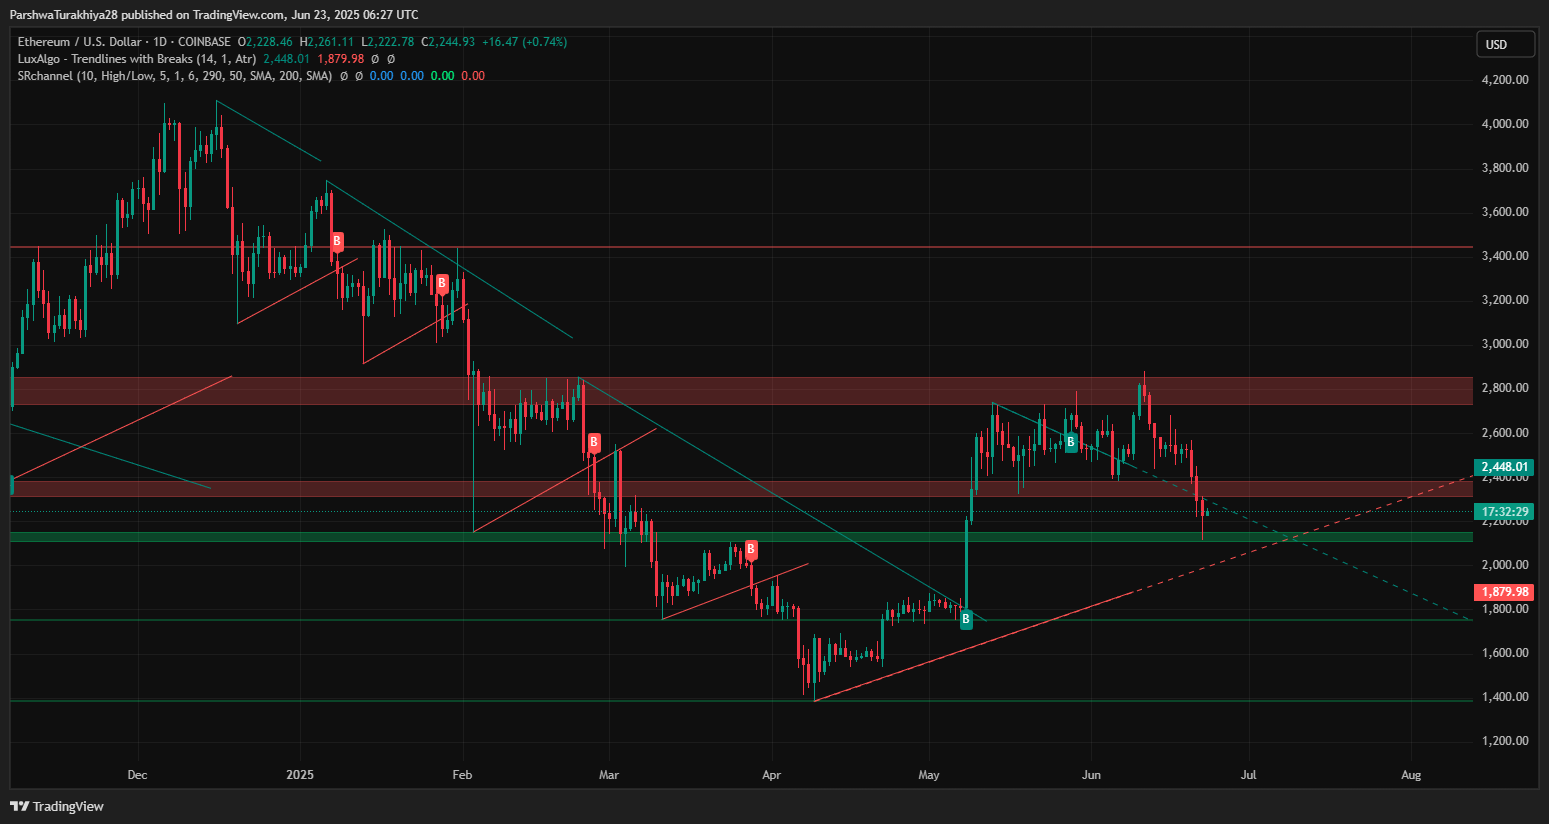
On the weekly chart, Ethereum price remains capped below the 0.5 and 0.618 Fibonacci levels ($2,744 and $3,066 respectively), while the current candle attempts to stabilize above the 0.236 retracement at $2,026. Despite a macro higher low, ETH failed to close above the 0.382 level ($2,424), reflecting continued selling at mid-retracement zones.

ETH price dynamics (Source: TradingView)
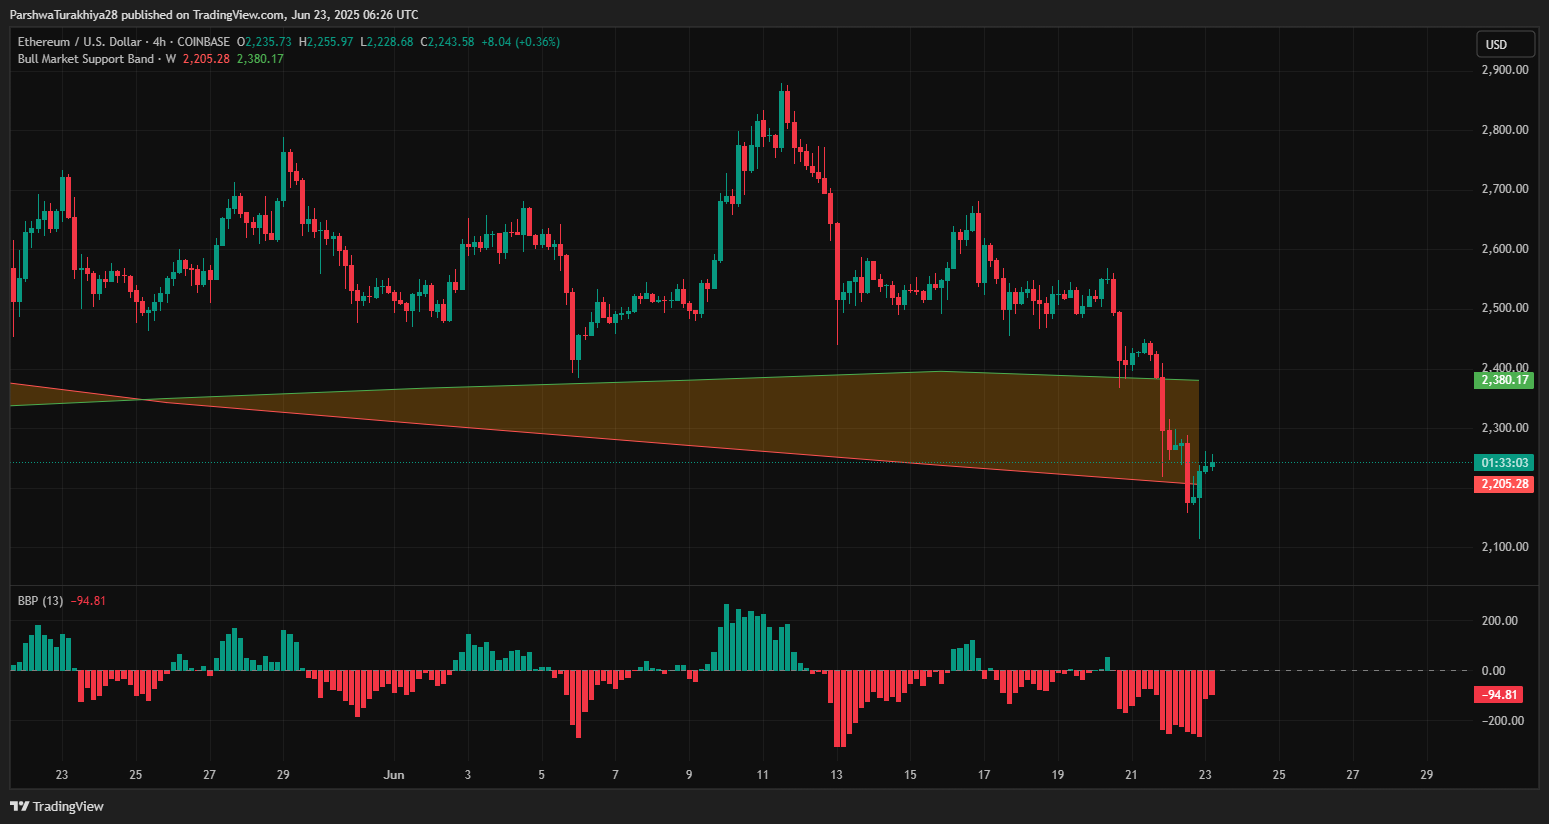
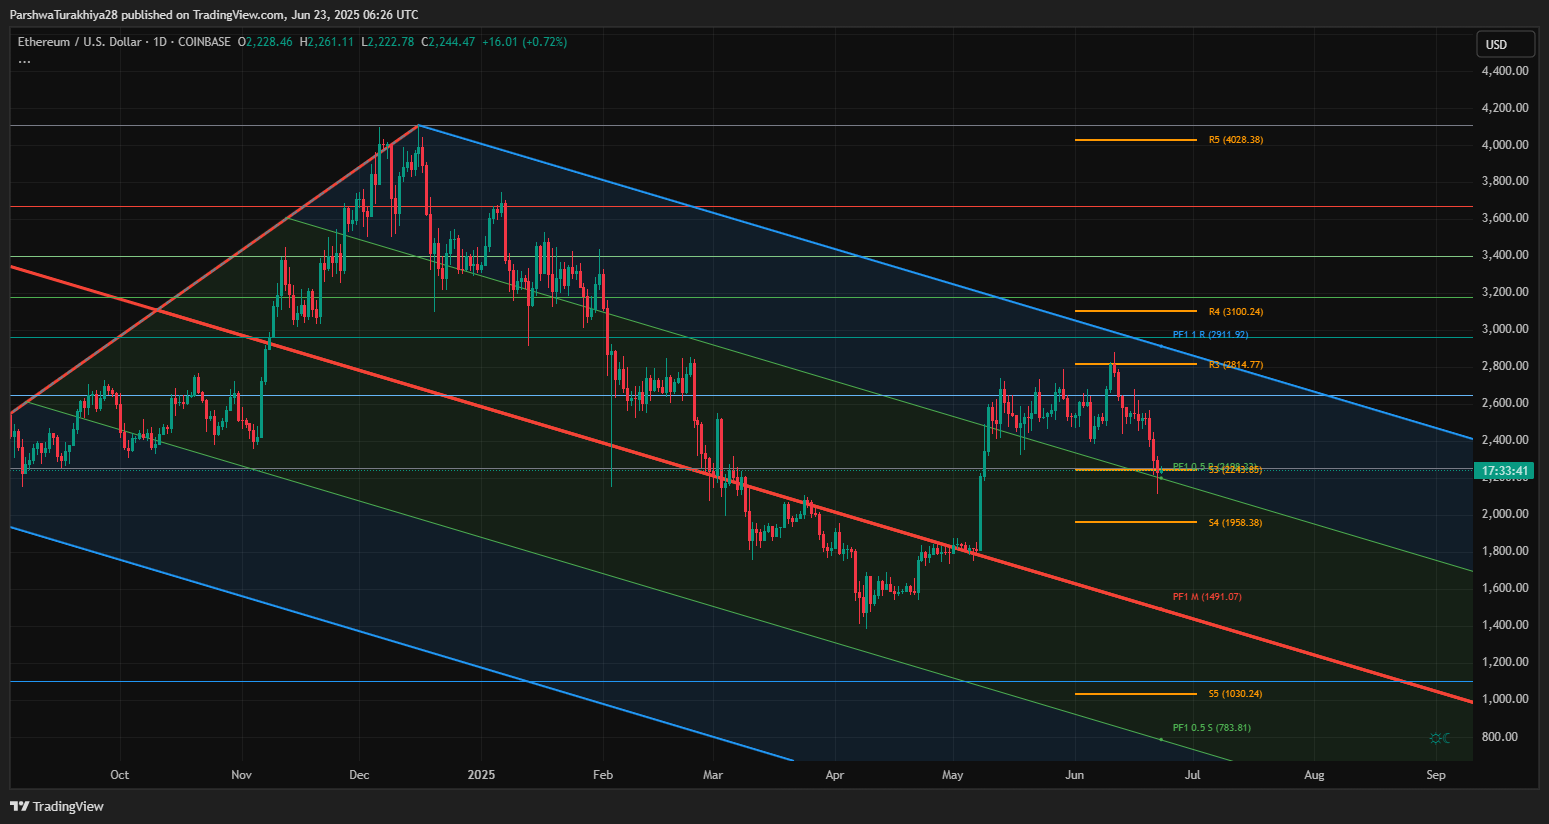
Meanwhile, on the daily timeframe, price has broken below a previously respected ascending structure and is now retesting the lower bounds of a broad descending parallel channel. Immediate support lies at $2,205, while key overhead resistance is aligned near $2,380 (Bull Market Support Band and Supertrend flip level).
Why Ethereum Price Going Down Today?

ETH price dynamics (Source: TradingView)
One of the main reasons behind the recent downside is rejection from a stacked confluence zone that includes the EMA100 ($2,435), EMA200 ($2,482), and Bollinger Band mid-line ($2,360). The Ethereum price action failed to sustain above these dynamic resistance levels, triggering liquidation-based selling toward $2,120.
ETH price dynamics (Source: TradingView)
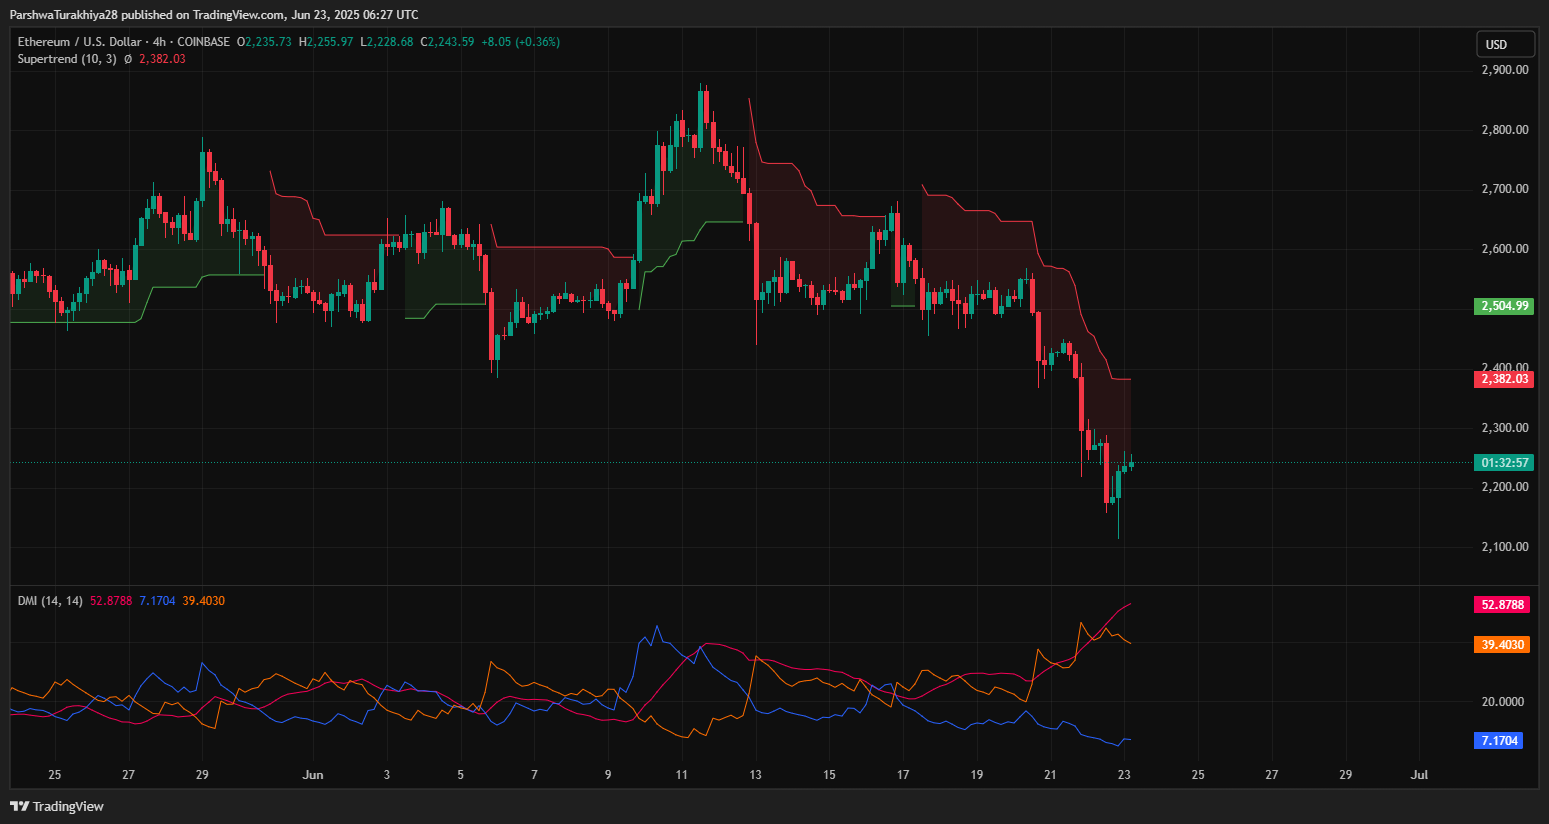
On the 4-hour chart, the Supertrend indicator remains bearish below $2,382, and the DMI (Directional Movement Index) shows -DI dominance at 52.87 while ADX climbs above 39 — suggesting a strong active trend in favor of sellers. The BBP (Bull Bear Power) has also stayed negative since June 17, confirming broad intraday weakness.
ETH price dynamics (Source: TradingView)
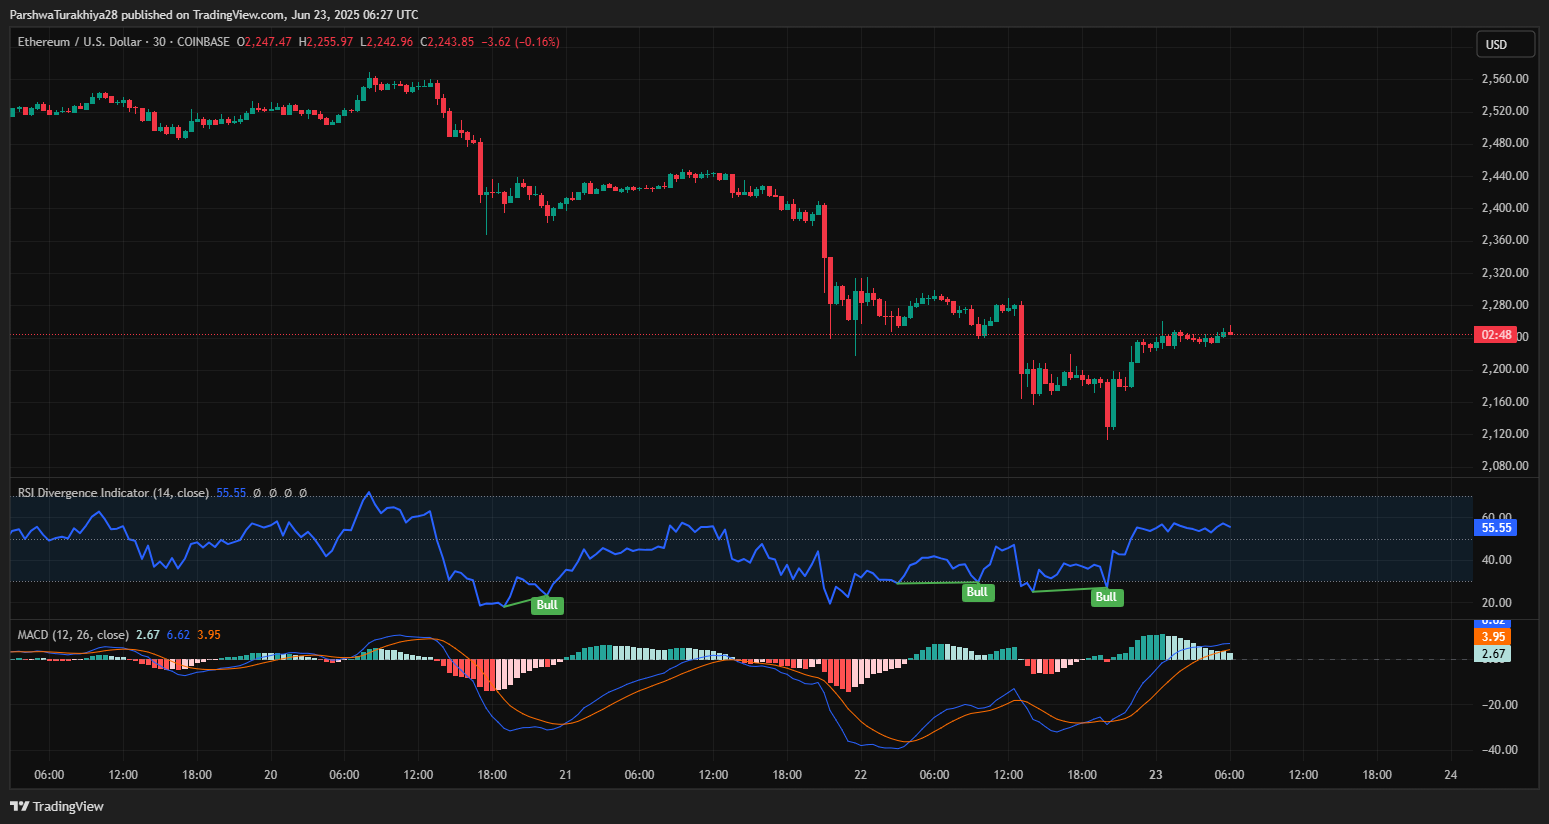
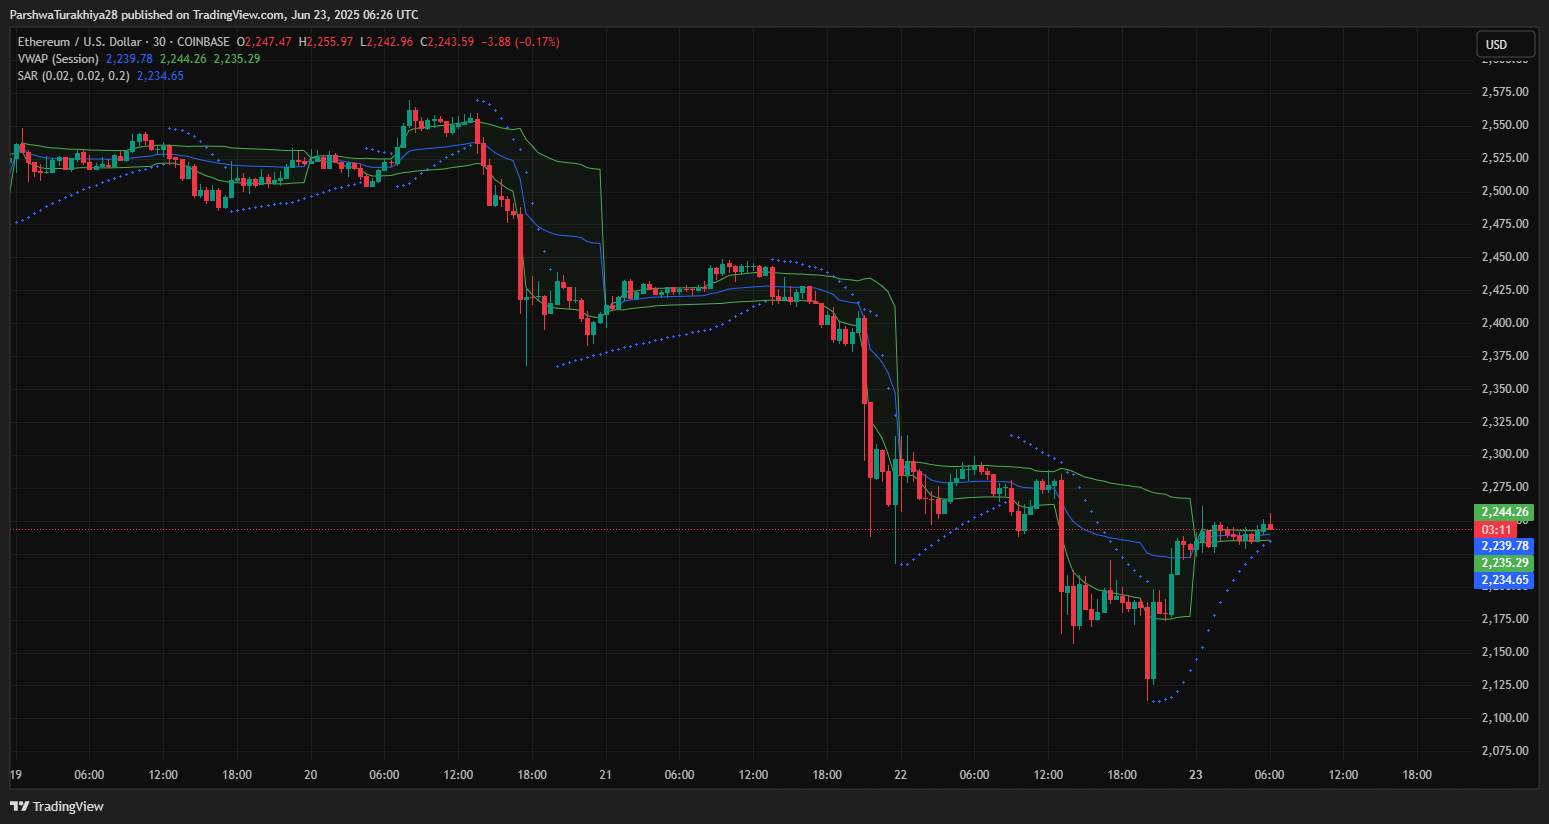
The 30-minute chart shows a slight divergence as RSI bottoms near 35 before recovering to 55.55. MACD crossover is bullish but remains shallow, and price continues to reject near the VWAP and Parabolic SAR levels clustered between $2,234 and $2,244 — indicating lack of momentum despite the recovery bounce.
Ethereum Price Volatility Persists Inside Bear Flag Channel
ETH price dynamics (Source: TradingView)
Short-term recovery attempts are meeting friction at the lower boundary of the previous rising wedge pattern. The Ethereum price spikes observed during late May have completely retraced, with the breakdown zone at $2,448 now acting as firm resistance. Unless ETH closes above this zone with volume confirmation, upside potential remains capped.
Bollinger Bands on the 4H timeframe are still wide but beginning to compress slightly, which often precedes a volatility breakout. However, candles are printing smaller real bodies, reflecting indecision among market participants.
Ethereum Price Update: Key Zones to Watch Heading Into June 24
ETH price dynamics (Source: TradingView)
If bulls are able to push past the $2,260–$2,280 short-term supply zone, Ethereum could retest $2,333 (EMA20) and potentially aim for the confluence near $2,380–$2,448. However, this will require volume support and a decisive break above the VWAP/SAR barrier.
ETH price dynamics (Source: TradingView)
On the downside, a drop below $2,200 would invalidate current short-term recovery setups and expose ETH to a retest of $2,026 — the 0.236 Fib support and a key liquidity pocket. Below that, the next breakdown trigger lies at $1,958, followed by deeper structure support near $1,880 and $1,490 (monthly pivot and lower channel band).
Given the conflicting signals across timeframes, Ethereum price volatility is likely to remain elevated, especially as the market approaches the final week of June.
Ethereum Price Forecast Table: June 24
With price now at a pivot, Ethereum must reclaim the $2,380 zone to validate a bullish reversal. Otherwise, bearish momentum remains dominant, with downside risk building toward $2,026 if short-term recovery falters.
Disclaimer: The information presented in this article is for informational and educational purposes only. The article does not constitute financial advice or advice of any kind. Coin Edition is not responsible for any losses incurred as a result of the utilization of content, products, or services mentioned. Readers are advised to exercise caution before taking any action related to the company.
Read the full article here


