


 Price Prediction For June 26")
After recovering from lows below $2,250, Ethereum price today is hovering near $2,445. The bounce has pushed ETH back into a heavy supply zone, but indicators suggest that bullish momentum is stalling just beneath the $2,505 resistance. With the broader crypto market stabilizing, Ethereum is now facing a critical test as it consolidates near short-term trendline resistance.
What’s Happening With Ethereum’s Price?
ETH price dynamics (Source: TradingView)
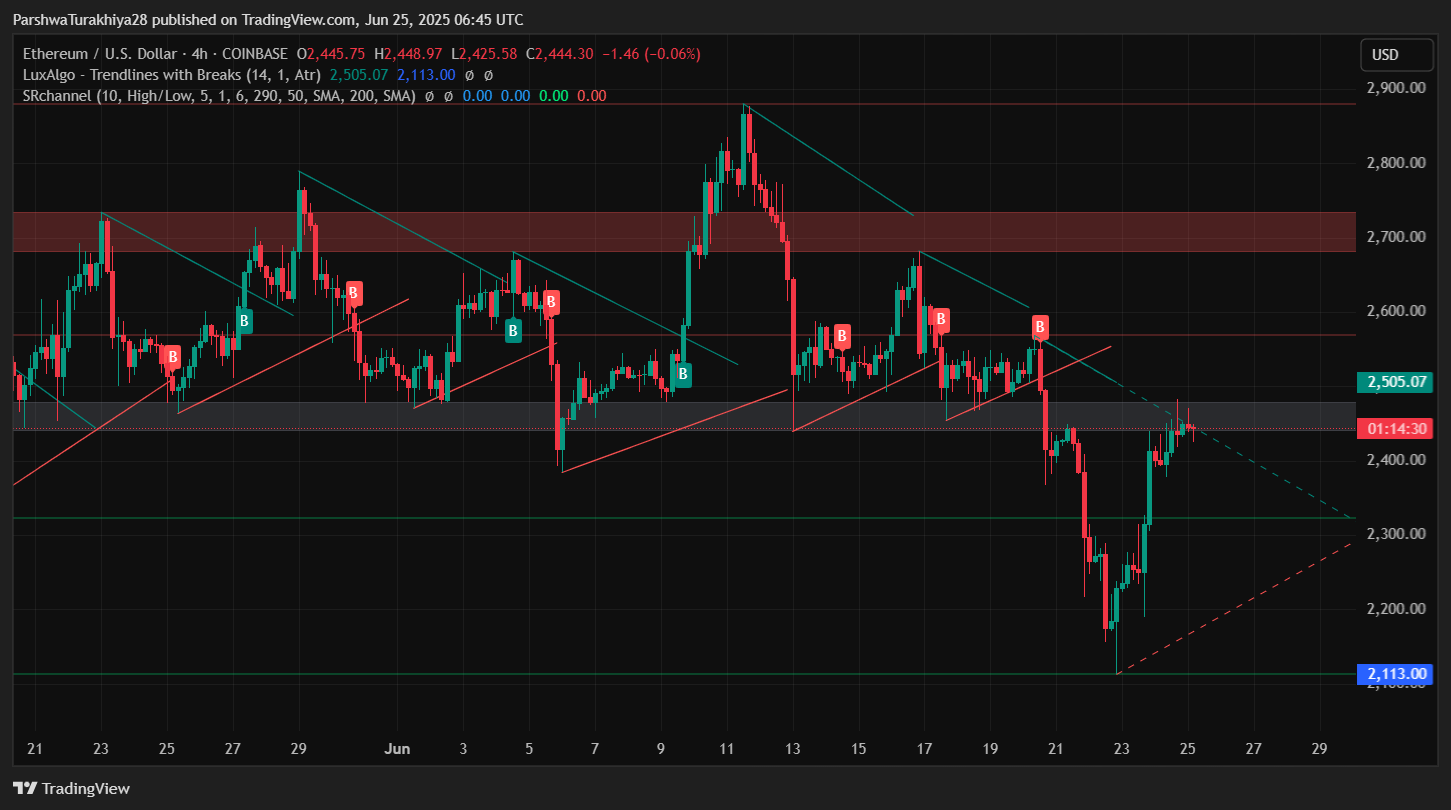
Ethereum price action shows a rising wedge structure on the lower timeframes, with the current consolidation forming just below the $2,465–$2,505 resistance band. On the 4-hour chart, ETH is trading just above the EMA100 and EMA200, both sitting around $2,421.02 and $2,385.10 respectively. The key EMAs have started converging, creating a support cluster that bulls must defend.

ETH price dynamics (Source: TradingView)
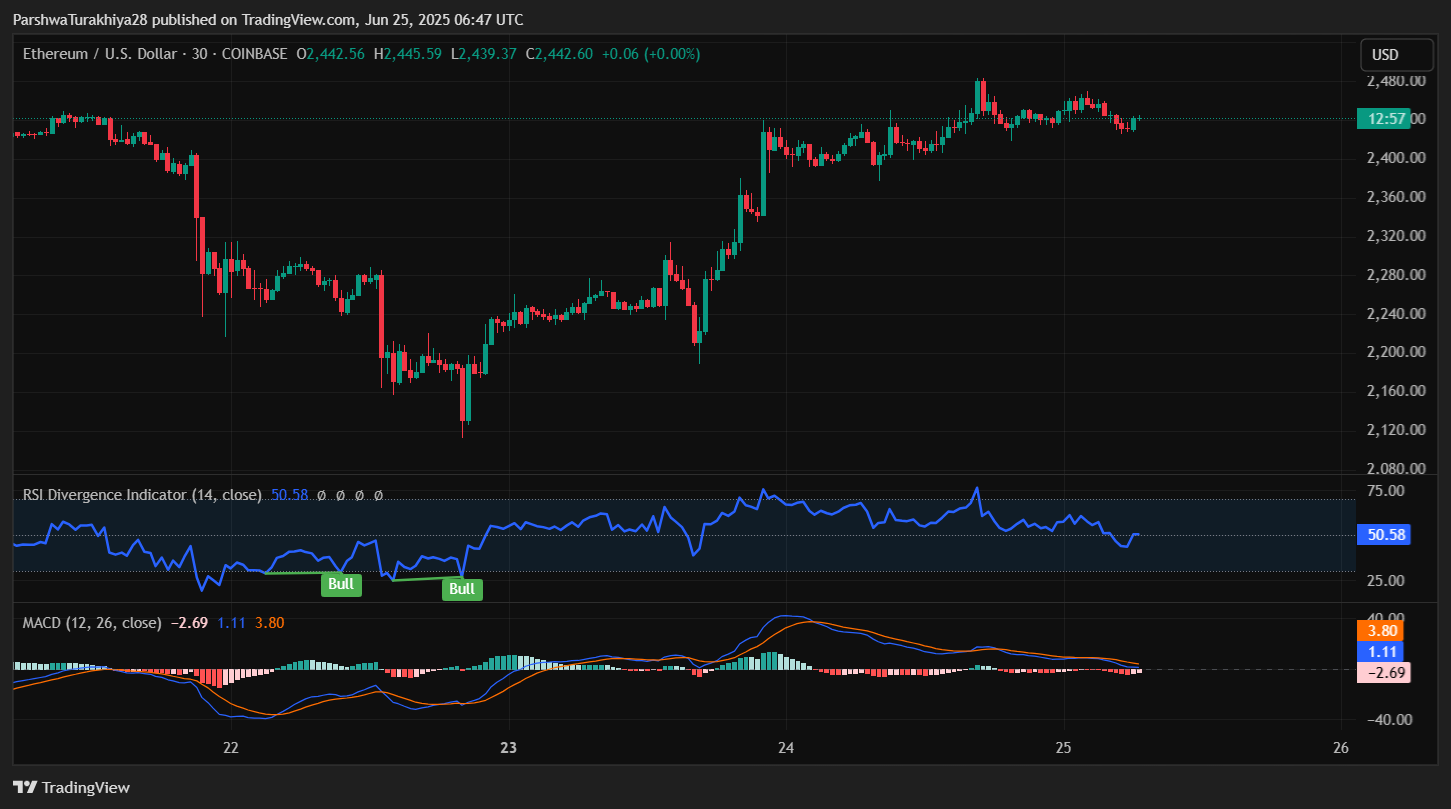
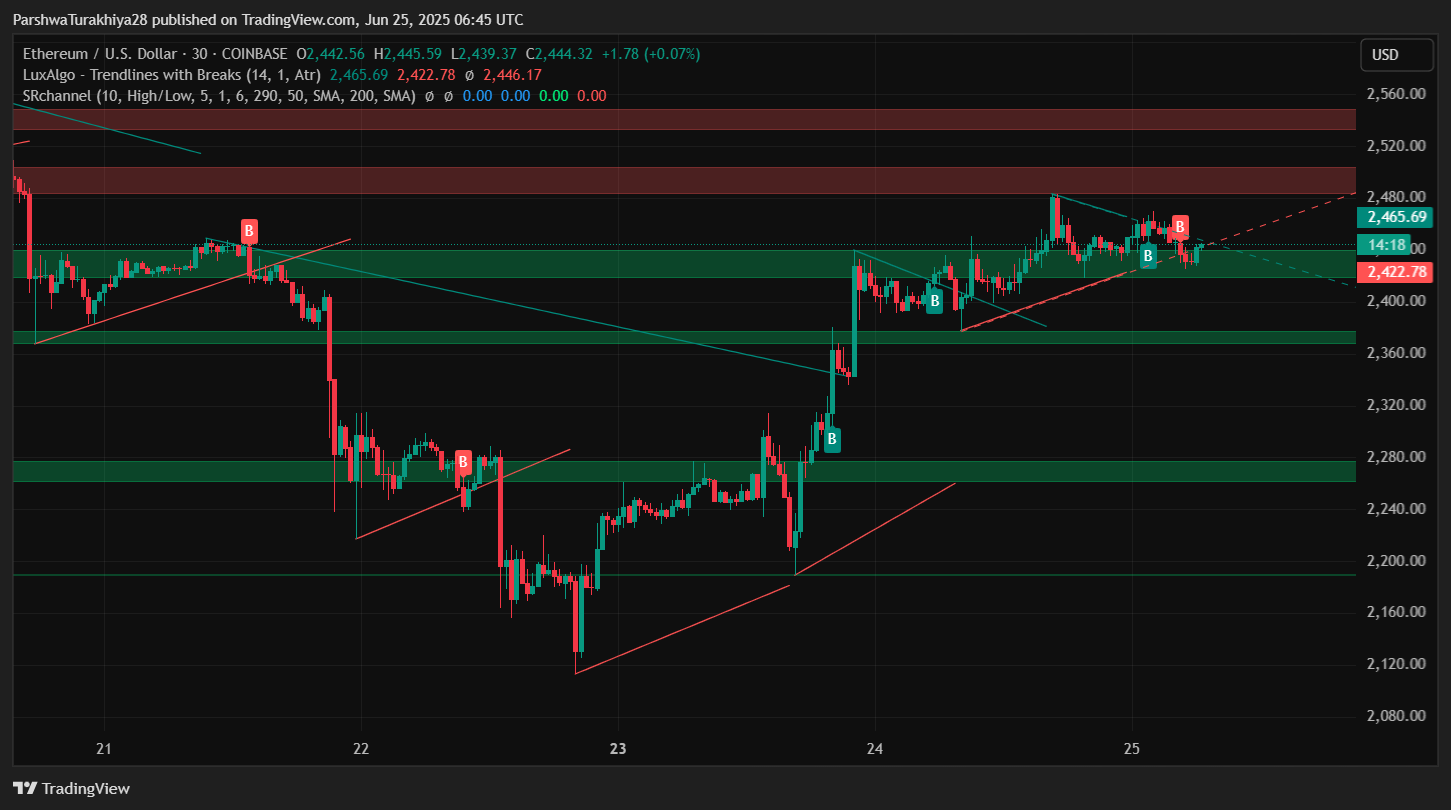
The Bollinger Bands are also narrowing on the 30-minute chart, with ETH trading in a tight range between $2,438 and $2,457. Parabolic SAR dots are sitting below price, supporting short-term bullish continuation. However, recent candles show small-bodied formations, hinting at a lack of conviction from buyers heading into June 26.
ETH price dynamics (Source: TradingView)
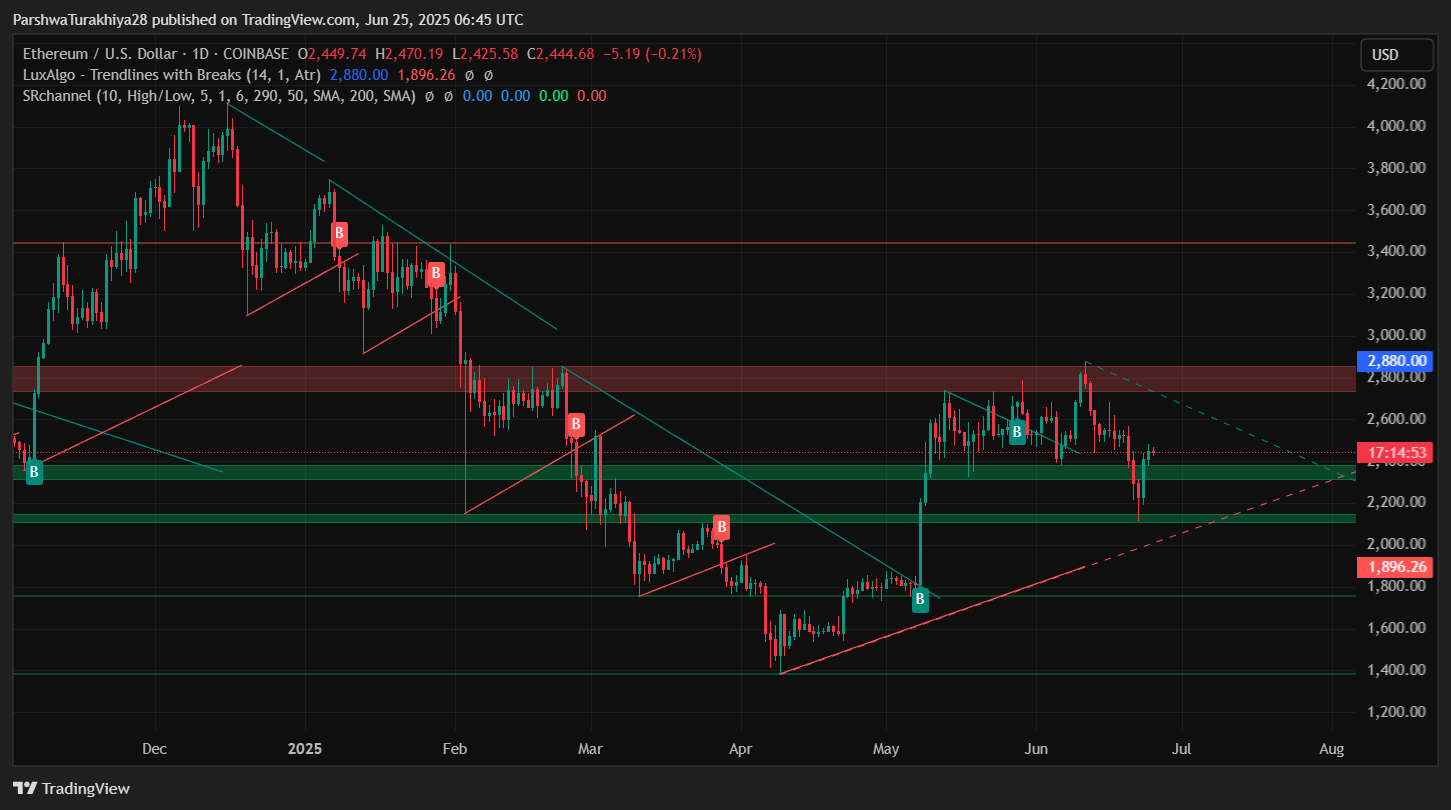
On the daily chart, ETH is attempting to bounce from a major ascending trendline originating from early May. This trendline now aligns with the $2,250 zone, while horizontal support remains intact at $2,138. As long as price holds above $2,400, bulls may maintain short-term control.
Why Ethereum Price Going Down Today?
ETH price dynamics (Source: TradingView)
Despite the recent Ethereum price spikes, bulls are facing headwinds. The RSI on the 30-minute chart is hovering around 50.58 — a neutral reading — reflecting fading momentum. Meanwhile, the MACD histogram has turned slightly negative, and signal lines are flattening, signaling potential exhaustion.
ETH Liquidation chart (Source: Coinglass)
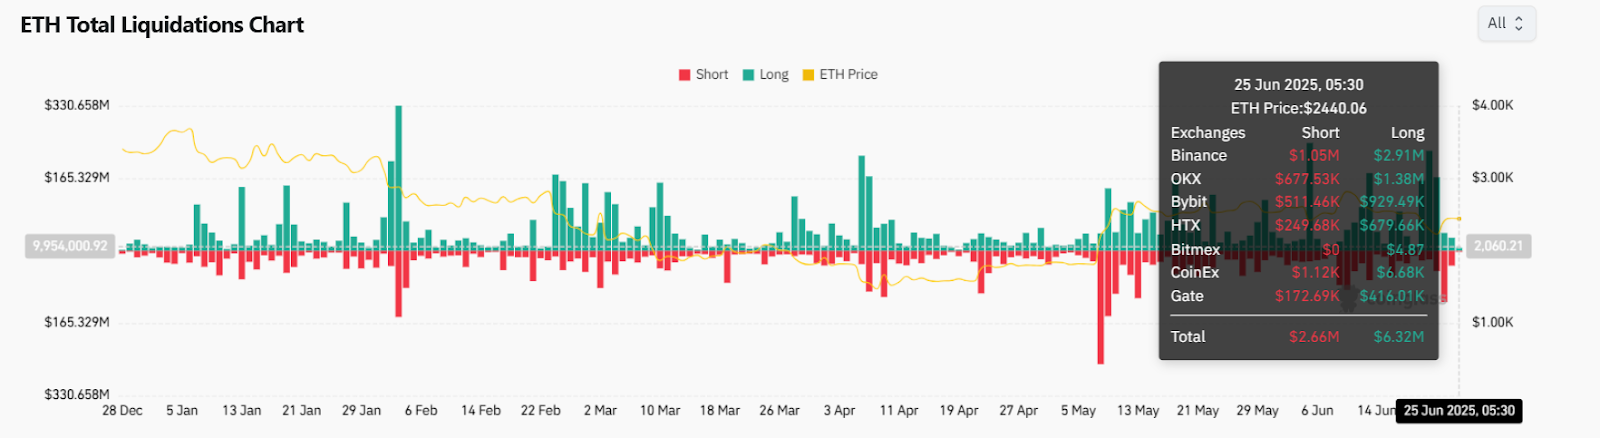
The liquidation heatmap shows a spike in long positions worth $6.32 million across major exchanges, compared to just $2.66 million in shorts. This leverage imbalance could pressure prices lower if bulls fail to sustain upside, especially near $2,500 where sellers are likely to re-enter.
ETH price dynamics (Source: TradingView)
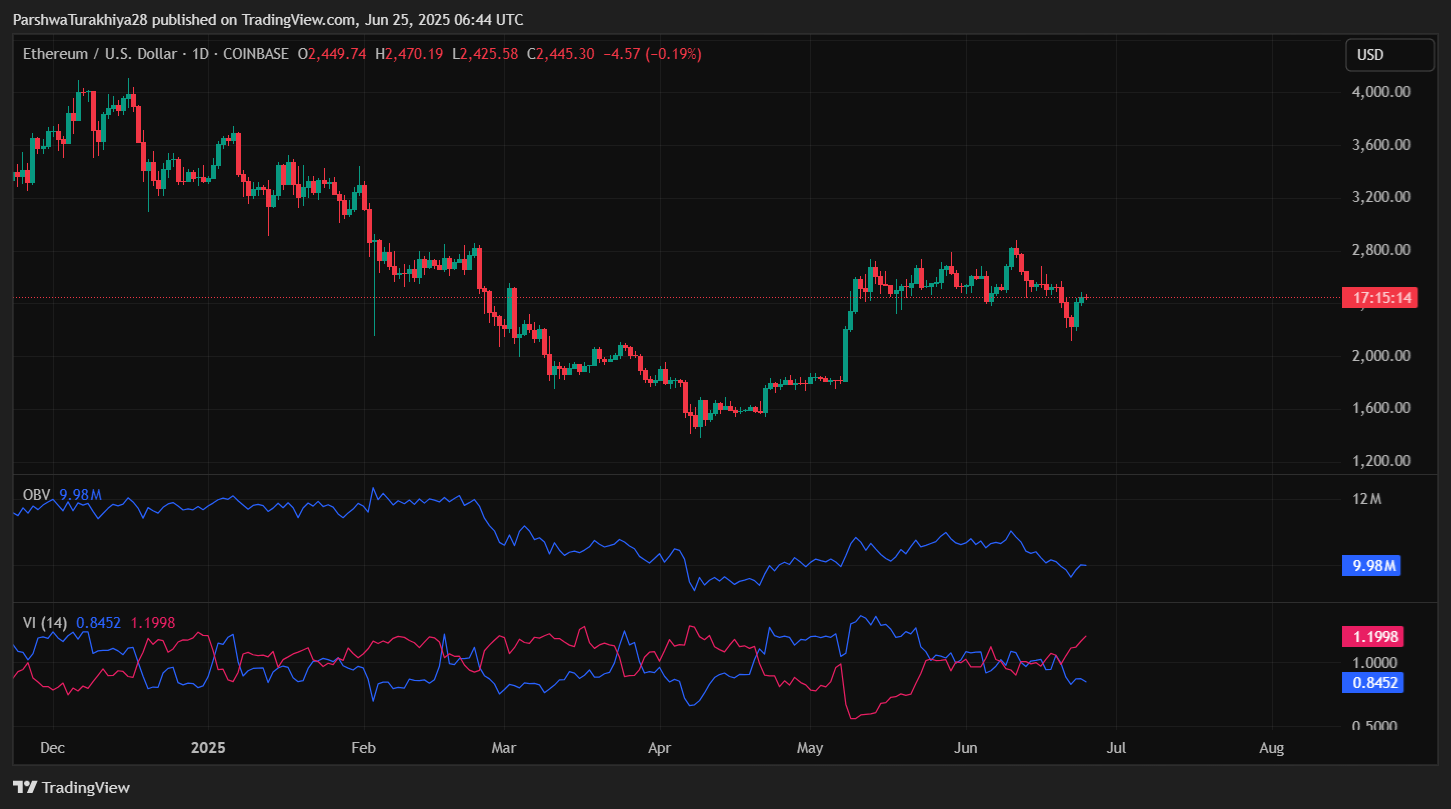
OBV on the daily chart is struggling to regain higher ground after a prolonged downtrend, sitting near 9.98M. The Vortex Indicator shows VI- (1.1998) crossing above VI+ (0.8452), confirming weakening bullish control. Unless volume increases and sentiment improves, the Ethereum price update suggests a possible short-term pullback.
ETH price dynamics (Source: TradingView)
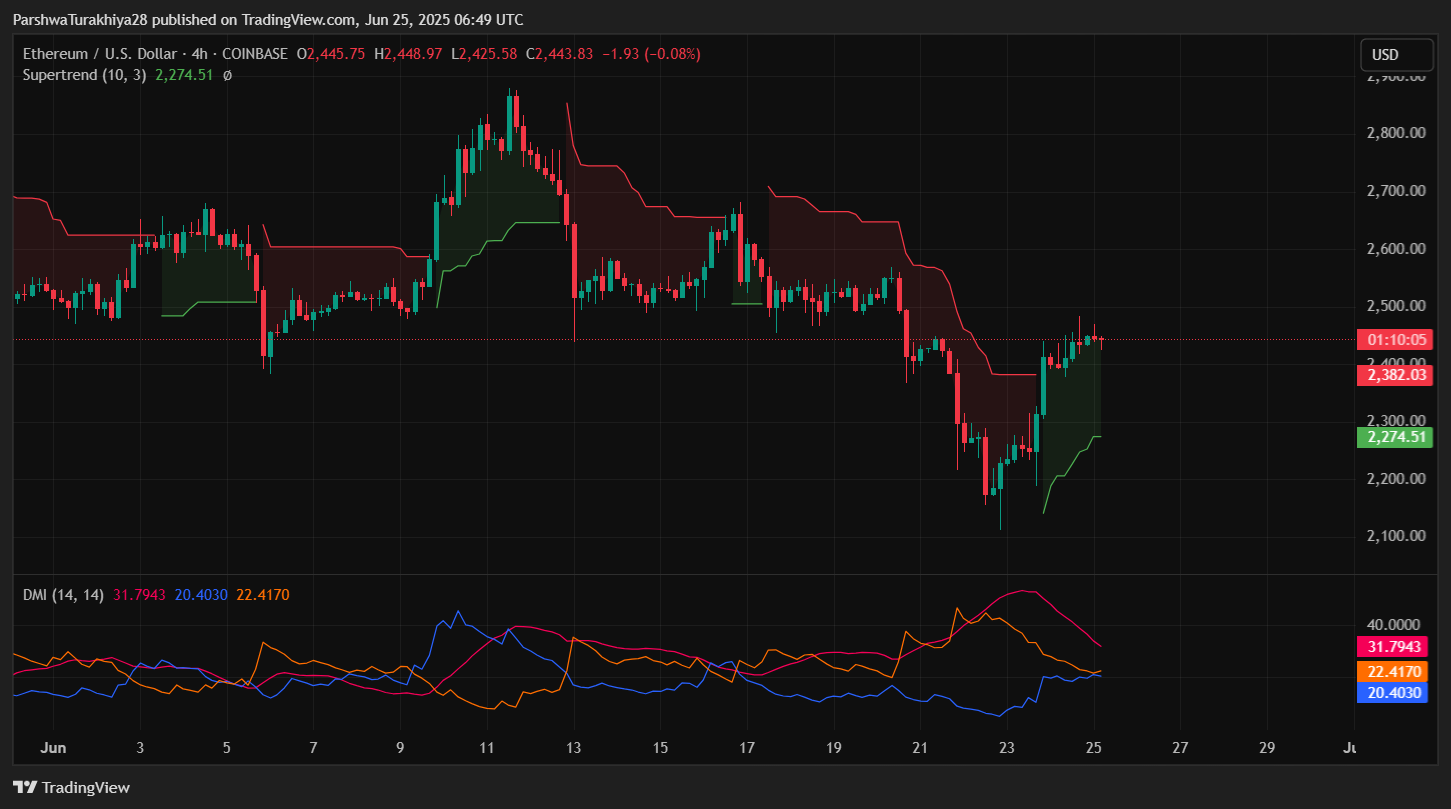
On the 4-hour chart, the Supertrend flipped bullish recently and currently supports price above $2,274.51. However, price is nearing the Supertrend resistance level at $2,382.03 — a zone that may dictate ETH’s immediate direction.
The DMI shows increasing strength in the bearish direction. The -DI is currently at 31.79 while +DI lags behind at 20.40, and the ADX is rising at 22.41. This divergence suggests that bears still hold the upper hand unless bulls deliver a decisive breakout above the local trendline.
Ethereum Price Indicators Point to Key Resistance Near $2,505
ETH price dynamics (Source: TradingView)
The $2,505 level now acts as a make-or-break zone. It has rejected price twice in the past two days and marks the upper boundary of a descending trendline from June 11. A break above with volume could open the gates to $2,700 and then $2,880 — levels that align with previous liquidity zones.
However, if ETH loses the $2,438–$2,426 consolidation base on the 30-minute chart, the next major support rests at $2,327 (lower Bollinger Band on the 4H chart) followed by $2,274 (Supertrend base).
Overall, Ethereum price volatility remains compressed. A breakout or breakdown from this wedge structure is likely in the next 24 hours.
ETH Price Prediction: Short-Term Outlook (24h)
ETH price dynamics (Source: TradingView)
Ethereum price is consolidating with narrowing volatility bands and neutral RSI, pointing to a breakout scenario. If ETH reclaims $2,505 and sustains above $2,530, momentum could carry it toward $2,700 and beyond. However, failure to breach the $2,465–$2,505 resistance could invite a drop back to $2,385 or lower.
Given the flattening MACD, neutral RSI, and selling pressure above $2,500, the next directional move will depend on volume and whether bulls can flip $2,505 into support. Traders should monitor liquidation clusters and Supertrend levels to confirm breakout or rejection.
Ethereum Price Forecast Table: June 26, 2025
Disclaimer: The information presented in this article is for informational and educational purposes only. The article does not constitute financial advice or advice of any kind. Coin Edition is not responsible for any losses incurred as a result of the utilization of content, products, or services mentioned. Readers are advised to exercise caution before taking any action related to the company.
Read the full article here


