- Ethereum price jumped to $2.6K, gaining over 5% over the past 24 hours.
- The analyst suggests a potential breakout for ETH.
As November prepares to make its entrance, the crypto market breaks and recovers from the bearish pressure. The trading day opened with the market exhibiting a 4.68% surge in market cap, reaching $2.4 trillion over the last day.
Notably, the largest cryptocurrency, Bitcoin, has broken above $71K. The largest altcoin, Ethereum (ETH), appeared to enter the bullish market, gaining over 5.53% over the past 24 hours. However, due to its bullish price action, ETH is poised for a remarkable upside rally for the day. At press time, Ethereum is trading at $2,620.
Over the day, Ethereum has recorded the lowest and highest prices at $2,471 and $2,627, respectively. Consequently, the market observed a liquidation of $39.95 million worth of Ethereum during this timeframe, as per Coinglass data. Meanwhile, the daily trading volume of ETH has surged by 93.18%.
On the other side, ETH has witnessed a mild dip of 1.10% over the last seven days. The asset began trading the week at $2,653, and the volatile market momentum dragged the ETH price down to the $2,387 mark.
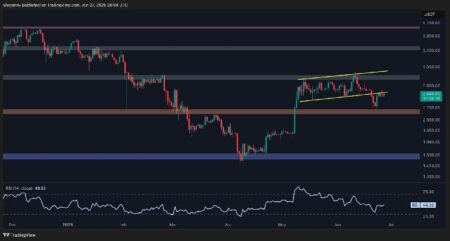
It is crucial to note the analyst chart as Ethereum’s price movement forms a consolidating triangle pattern within narrowing trendlines, suggesting a breakout. The chart highlights a neutral to a brief positive outlook for ETH.
Will Ethereum’s Rally Hold Strong?
Ethereum’s four-hour technical indicators suggest the Moving Average Convergence Divergence (MACD) line is positioned above the signal line, inferring the bullish signal, and can expect the incoming bull run.
ETH chart (Source: TradingView)
Besides, the Chaikin Money Flow (CMF) indicator is found at 0.10, hinting at the increased money flow with a positive outlook. In addition, the daily trading volume of ETH has reached $21.76 billion.
Furthermore, the current market sentiment is neutral, as the daily relative strength index (RSI) is above 60. The altcoin’s daily frame exhibits the short-term 50-day moving average above the long-term 200-day moving average.
While looking at the four-hour price chart, ETH has recently surpassed the $2,590 mark. If the asset breaks past the $2.7K, the asset can rally toward the $3K zone. On the other hand, if the asset falls back from the current price level, it might trigger the ETH price toward the nearby $2,500 support zone.
Read the full article here


