


On Thursday, June 19th, the crypto market experienced low volatility trading as investors projected FUD (fear, uncertainty, and doubt) surrounding the geopolitical tensions in the Middle East. The Ethereum price proves this market sentiment with a neutral candle formation in the daily chart, positioned above the $2,500 level. However, the high-net-worth investor remained unfazed by this consolidation and continues to show an active accumulation trend.
Ethereum Poised For Reversal Amid Whale Buying Spree
Over the past week, the Ethereum price has plummeted from a multi-month high of $2,880 to its current trading value of $2,534, registering a 12% decline. This bearish trend primarily followed the broader market decline amid the escalating military action in the Middle East.
Despite the potential for further downfall, the on-chain data highlights renewed accumulation from ETH whales. According to blockchain tracker Spotonchain, a major institutional whale has spent over $220.82 million in USDC to acquire 85,465 ETH through OTC deals with Wintermute and Coinbase over the past week.
ETH Whale Activity | Spotonchain
Early today, the whale purchased another 15,000 ETH for $37.16 million at an average price of $2,477. Despite facing a floating loss of $4.97M (-2.25%), the investor still holds $112.94M USDC on Aave and has staked the entire 85,465 ETH with Lido, signaling high long-term confidence in Ethereum’s growth.
In parallel, another crypto whale operating under the wallet address “0xf680″ purchased 3,000 ETH (worth approximately $7.48 million) just nine hours before Lookonchain’s report. This purchase has increased the whale’s holdings to 11,500 ETH (valued at $29M) over the last four days.

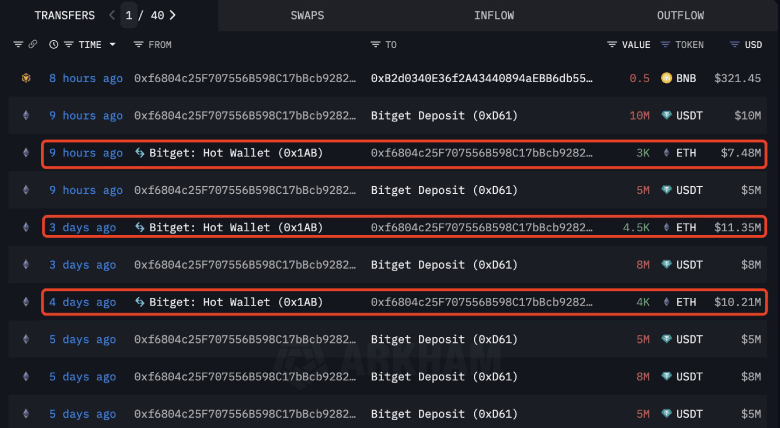
Lookonchain
Historically, such a whale accumulation trend has coincided with a major market bottom, emerging as a potential signal of bullish reversal.
Inverted Head & Shoulder Pattern May Push ETH for $3,000 Breakout
Ethereum’s daily chart analysis indicates that its price has been ranging between $2,400 and $2,850, reflecting market uncertainty.
Despite the uncertainty, this consolidation revealed the formation of a well-known reversal pattern known as an inverted head-and-shoulders. The chart setup is characterized by three troughs: an initiation drop that develops to the left shoulder, followed by a major dip called the head, and later a renewed recovery with a temporary pullback as the right shoulder.
Currently, the Ethereum price displays long-tail rejection candles at the $2,500 support level, indicating an intact buy-the-dip sentiment among market participants. If the pattern holds, the coin price could bounce 13.5% to challenge the neckline, potentially breaching it and signaling a change in market direction, as indicated by the addition of $2,870.

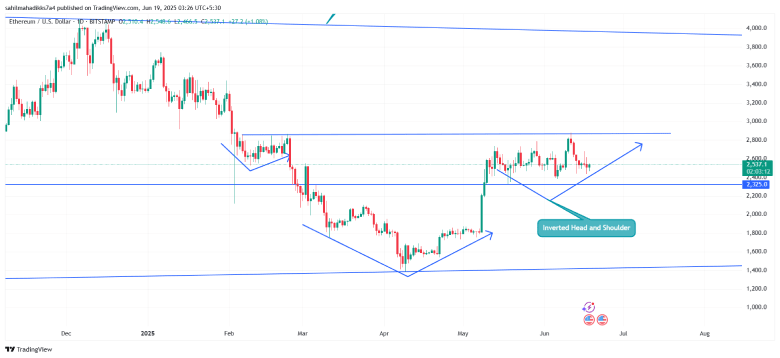
ETH/USDT – 1d Chart
The post-breakout strategy could push the asset another 35% and hit the $3,900 mark.
On the contrary, if sellers continue to define the overhead resistance at $2,860, the buyers’ return consolidation could extend to July.
Also Read: Trump May Take Action to End Iranian Nuclear Enrichment: JD Vance
Read the full article here


