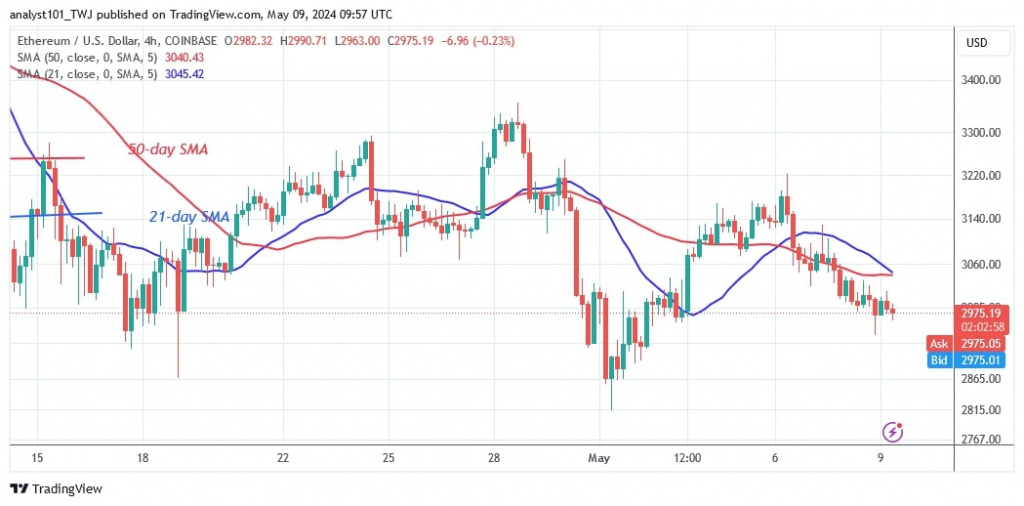
The price of Ethereum (ETH) has fallen to the current range of $2,908 to $3,122, which is the 21-day moving average line or resistance.
Long-term analysis of the Ethereum price: bearish
The bulls made an effort to break the 21-day SMA but were rejected. Ether is falling and approaching the current support level of $2,908. If the current support is broken, the largest altcoin will fall below its previous low of $2,848. This would widen the current price range. Nonetheless, the current price range will remain if the support levels hold. Ether is currently valued at $3,032.
Analysis of the Ethereum indicators
Since the price drop on April 13, Ether’s price bars have remained below the moving average lines. The bulls have retested the 21-day SMA three times but have been rejected as the cryptocurrency continues to fall. On the 4-hour chart, the moving average lines are sloping horizontally, indicating a sideways movement since the end of the downtrend on April 13.
Technical indicators:
Key resistance levels – $4,000 and $4,500
Key support levels – $3,500 and $3,000
What’s next for Ethereum?
The largest altcoin has returned to its trading range, pushed back from the moving average lines. Ether has fallen and is approaching the current support level of $2,908. If the current support holds, Ether will resume its uptrend and trade within its range. Since April 13, bulls have effectively protected the current support level as it rallies. Long candlestick tails pointing below the existing support indicate strong downside pressure at lower price levels.

Disclaimer. This analysis and forecast are the personal opinions of the author and are not a recommendation to buy or sell cryptocurrency and should not be viewed as an endorsement by CoinIdol.com. Readers should do their research before investing in funds.
Read the full article here

