Ethereum price action in the past shows a bullish divergence. As per the analysis of market analysts, there will be a massive surge over 43% with the price ranging between $4,811 and $4,867.
If successful, this would be a massive achievement for Ethereum as it edges close to previous all time highs.
After this, Ethereum can ascend into an explosive growth phase and break towards an ambitious $8,000 valuation within the next few months.
Source: X
Ethereum Price: Path to $4,800, A Critical Milestone
In the past few weeks Ethereum has been consolidating in a relatively narrow range while showing hints of coiling up for a major move.
A psychological and technical milestone has emerged at the $4,800 level. Should Ethereum break through this resistance zone, not only would this cement Ethereum as bullish, it would reinvigorate optimism in the crypto space as a whole.
We have several bullish patterns on the current technical setup. On the macro scale, Ethereum appears to be painting the picture of an inverted cup and handle pattern historically signaling the continuation of a bull run.
– Advertisement –
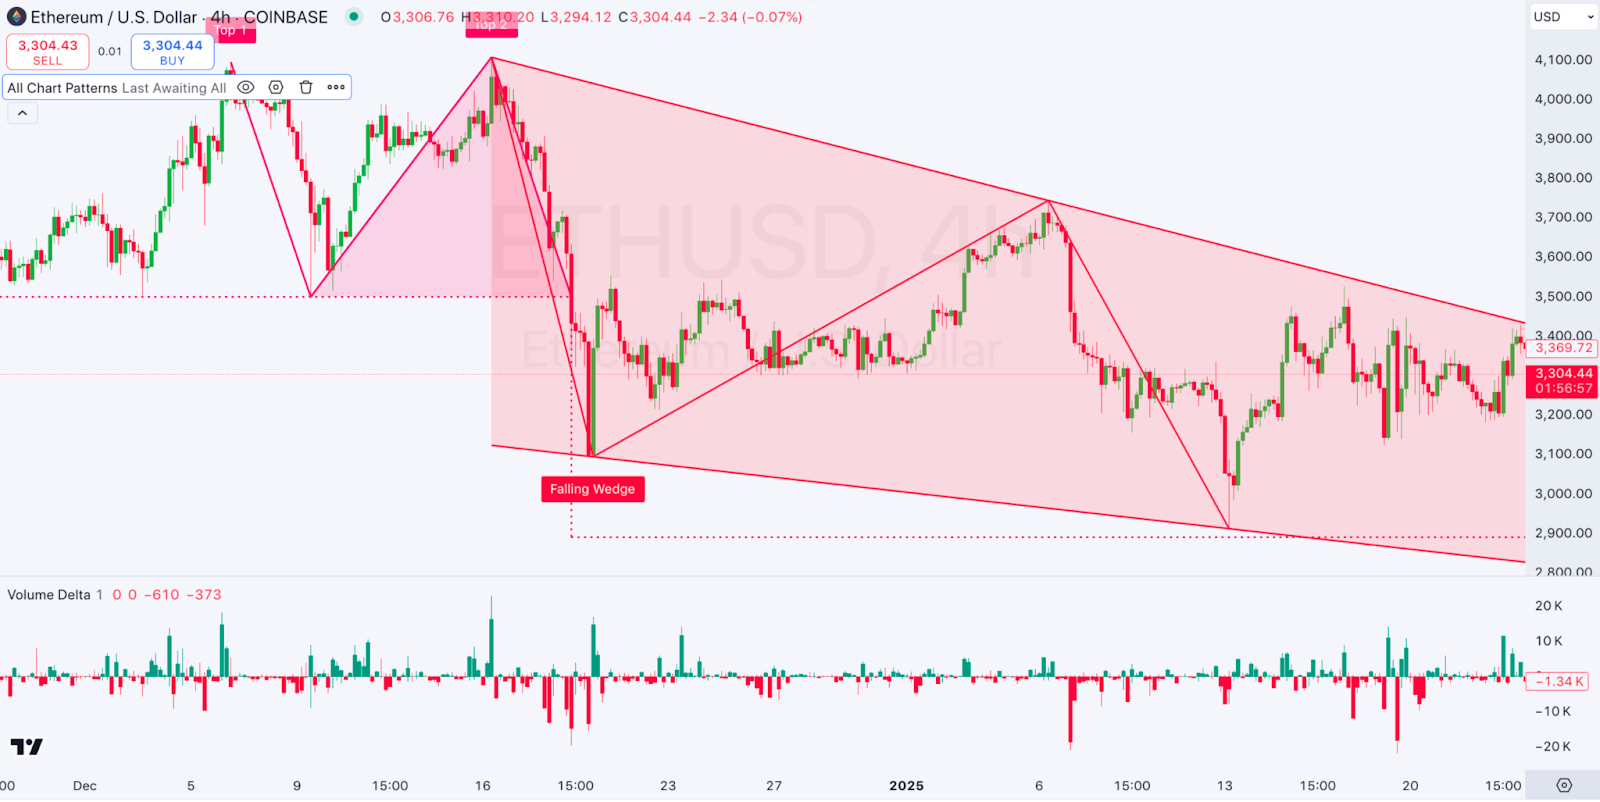
On a shortened time frame, we can see a falling wedge pattern on the 4 hour chart which is generally a reliable reversal signal that follows a strong upwards price momentum.
This follows Ethereum’s recent attempts to push the price to higher levels as this could be the beginning of a breakout.
This bullish narrative is further added to by the steady incline in volume during the upward Ethereum price movements.
The below volume delta data confirms the idea that buyers come in aggressively as Ethereum is consolidating as the spikes in the trading activity is highlighting.
The structurally sound foundation for a sustained rally is also provided by higher lows in recent price action.
Historical Patterns and the Road to All-Time Highs
Historical performance during cryptos during similar consolidation periods is a major thing working in favor of Ethereum bullishness.
Historically, Ethereum price has tended to amass strength when volatility is low, before telegraphing explosive moves to the upside.
The market structure currently resembles these previous patterns and Ethereum remains firmly above the $3,300 support zone, a key level necessary to sustain the uptrends.
If Ethereum breaks past $4,800 it won’t only mean recovery from recent corrections, but it will also set the stage for another try at all time high.
If it reaches such a level, it would start an astronomical buying pressure, retail and institutional investors included.
Such a scenario could pave the way for Ethereum to chart a course toward its next major target: $8,000.
Further validation is provided by the technical charts. If Ethereum price can crack $4,800 and keep the flame for a while, the lack of major resistance walls from $5k to $8k may make for a comparatively easy upward climb.
But that is if other factors come into play, such as Bitcoin’s price action and overall market conditions.
Technical Analysis: Patterns, Momentum, and Key Levels
Ethereum’s recent price action is further reinforcing bullish potential. The falling wedge pattern on the 4-hour chart is one of those suggestions that a breakout is coming, as discussed.
It usually precedes major upward movements, as decreasing price highs and lows within converging trend lines characterizes this pattern.
The final validation to the wedge volume declining further confirms the possibility of a sharp breakout once the pattern comes to an end.

4-hour ETH/USD Chart | source: TradingView
Ethereum’s price structure on the daily chart is showing higher lows, a classic bullish momentum indicator, that’s an indication of accumulation.
The critical base showing strong buyer interest has been the $3,300 support zone, where this upward trajectory bounced off.
Breaking above the $4,800 resistance zone could see Ethereum reach the next major resistance area at $5,000, making the road to $8,000 increasingly clear.
The Relative Strength Index (RSI) h is moving toward the overbought territory indicating significant buying pressure.
Read the full article here

