


Ethereum (ETH) has experienced a price breakout in the weekly timeframe, comfortably trading above the $3,500 resistance as the decentralized finance (DeFi) asset targets the crucial $4,000 mark.
The sustainability of this newfound momentum is of key interest to the general cryptocurrency market, as it is viewed as a precursor to the start of an altcoin season heading into 2025.
Notably, as of press time, Ethereum was trading at $3,569, having rallied by over 1% in the last 24 hours. On the weekly chart, ETH is up almost 8%.
As reported by Finbold, following the recent momentum, several analysts have offered a mixed outlook for the asset.
For instance, after temporarily breaching the $3,600 resistance, prominent on-chain cryptocurrency analyst Ali Martinez set a short-term target of $6,000 for ETH. This move would likely add more credence to the altcoin season.
Ethereum Rainbow Chart insights
To confirm the possibility of an altcoin rally, Ethereum will need to build on its current gains throughout 2024 and into the new year. In this regard, the Ethereum Rainbow Chart, a popular tool among investors and traders, offers insights on what to expect on the first day of 2025.
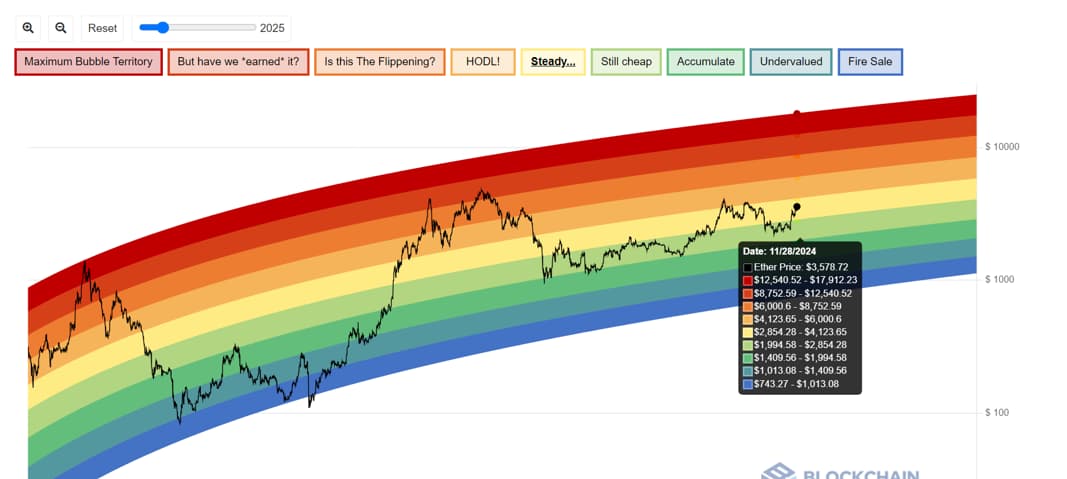
The chart visually maps ETH’s historical price data on a logarithmic scale, with color-coded bands representing different price zones, from “Fire Sale” at the low end to “Maximum Bubble Territory” at the high end.
These representations are meant to help investors assess Ethereum’s current price in relation to its historical performance and suggest potential future price targets.
The chart placed Ethereum in the “Steady” zone at press time, ranging between $2,854 and $4,123. This suggests that the DeFi asset’s price is in a phase of steady performance without significant upward or downward pressure at the moment.
ETH price prediction for January 1, 2025
Regarding the future price of the second-ranked cryptocurrency by market cap, the Rainbow Chart projects that Ethereum could trade between $761.55 and $18,254.39 on the first day of 2025.
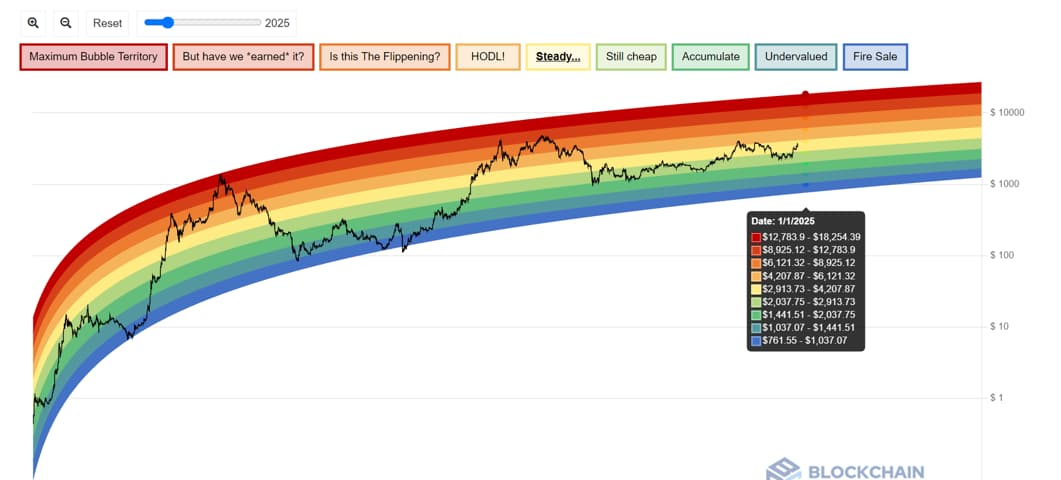
At the top, “Maximum Bubble Territory” places Ethereum between $12,783.90 and $18,254.39, signaling extreme overvaluation and a potential market bubble. Below the “Maximum Bubble Territory,” the “But have we earned it?” zone from $8,925.12 to $12,783.90 points to slight overvaluation, with prices potentially exceeding fundamental growth.
The “Is this the Flipping?” zone, spanning $6,121.27 to $8,925.12, marks a milestone at which Ethereum may surpass past highs without excessive inflation.
Additionally, the market will appear healthy and attractive to long-term holders in the “HODL!” zone, which predicts ETH will trade between $4,207.87 and $6,121.32 on January 1st.
The “Steady” zone, ranging from $2,913.73 to $4,207.87, reflects stability and potential moderate growth. Below this, the “Still Cheap” zone, $2,037.75 to $2,913.73, signals undervaluation and a buying opportunity.
The “Accumulate” zone ($1,441.41–$2,037.75) signals significant undervaluation, while the “Undervalued” zone ($1,037.07–$1,441.51) offers a strong entry point for long-term investors.
Currently, in the “Steady” zone, Ethereum needs to breach the $4,000 resistance to advance toward the higher bands of the chart.
Finally, the “Fire Sale” zone ($761.55–$1,037.07) represents deep undervaluation with high-risk, high-reward potential as of January 1, 2025.
Featured image via Shutterstock
Read the full article here


