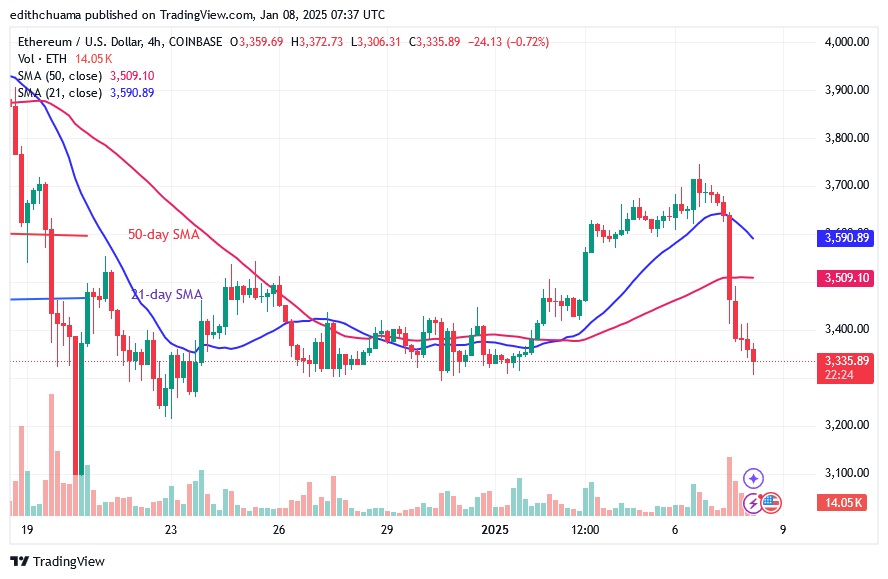
Cryptocurrency price analysis brought by Coinidol.com. The price of Ethereum (ETH) has fallen below the moving average lines after rejecting the high at $3,746.
ETH price long-term analysis: bearish
Buyers have failed to sustain the positive momentum until the key price level of $4,000. Today, the largest altcoin was rejected at the $3,700 high and fell to $3,312. The selling pressure has eased and the altcoin is now hovering around the $3,300 support level.
Since December 26, the bears have failed to push the price below the $3,300 support level. However, if Ether loses its $3,300 support, the market will fall further to a low of $3,000.
Analysis of the Ethereum indicators
The price bars for Ether are below the moving average lines due to the recent decline. The cryptocurrency will continue to fall as long as it remains below the moving average lines. However, the bulls have been defending the current support level of $3,300 since December 26, 2024.
The 4-hour chart shows long candlestick tails pointing to support at $3,300. These results suggest that there is significant buying pressure at lower price levels.
Technical Indicators:
Resistance Levels – $4,000 and $4,500
Support Levels – $3.500 and $3,000
What is the next direction for Ethereum?
On the 4-hour chart, Ether has fallen below the moving average lines. After its recent decline, Ether has been trading in a range of $3,300 to $3,700. The selling pressure has stalled above the $3,300 support. Since December 22, 2024, the cryptocurrency has remained above the $3,300 support.

Disclaimer. This analysis and forecast are the personal opinions of the author, are not a recommendation to buy or sell cryptocurrency, and should not be viewed as an endorsement by CoinIdol.com. Readers should do their research before investing in funds.
Read the full article here

